(credits)
Back in 2008, when the World Air Quality project started, all of the existing air quality monitoring stations where based on highly professional and expensive BAM and TOEM technology. This kind of stations are always maintained by professional and highly qualified operators - and this ensures that the output of this station can be trusted.
12 years later, the BAM and TOEM stations still do exist. But with the development of laser scattering technology and low-cost dust sensor, the BAM and TOEM stations are now outnumbered by immense and dense low-cost sensor networks. Nowdays, there are just so many of those networks - to name a few: urad, luft-daten, airqo, airbg, opensense, yakkaw, econet, airkaz, ccdc, ambente, green air, etc..
One of the fundamental issue with the low-cost sensor network is their reliability: Since many of those sensors are not properly maintained (or not maintained at all), the amount of sensor producing completely wrong measurement is not negligible. Moreover, most of the network do not use stations with replicated sensors (unlike our Gaia station, which uses 3 replicated sensor), making it even more difficult to know when a single sensor is failing.
In this article, where will be looking at the sensor network deployed in the wonderful city of Volos in Greece, and study means to qualify and quantify station reliability in real-time.
--
The wonderful city of Volos in Greece
Volos (Greek: Βόλος) is a coastal port city. With a population of 144,449 (2011), It's also the sixth-most-populous city of Greece. It is an important industrial center, while its port provides a bridge between Europe and Asia. There are currently 5 stations in Volos: One from the Greek EPA, providing hourly data from a professional BAM station, and 4 low-cost real-time stations from the lutf-daten network:
The Volos EPA station is located at the building of the Decentralized Administration of Thessaly and Central Greece. All of the other stations are also located in residential areas, with the exception of Argonafton which is located next to the port.
The traffic in the port is not negligible, with an average of about 8 ships arrival/departure per day, with 80% of the ships being cargoes - at the time of writing.
One of the known problems with cargoes can be the particle pollution from exhaust pipes, due to low-quality fuel. But looking at the panorama from where the Argonafton station is located, the distance to the cargoes is sufficiently far not to justify a constant air pollution source. One could expect to see a few times when the air is more polluted in Argonafton, especially when large boats are manoeuvring, but not all of the time. After all, that's only 8 ships manoeuvring a day.

--
Past 30 days time-series data
Based on the information from the location of the stations, one could expect that all the of the stations agree on similar levels of air pollution, with the exception of sporadic higher pollution events for Argonafton. But well, unfortunately, this not really the case, as confirmed from the time-series graph plot below:
The time-series plot clearly indicates that the data for Argonafton seems over estimated compared to other stations. Similarly, the data for Dimarxou seems under estimated.
A better to highlight the issue is to visualize the daily 75th AQI percentile, plotted using the corresponding AQI color range. The deviation from Argonafton is obvious. Moreover, it is possible to distinguish two clusters centered around Riga-Feraiou+Kasthanaías and Volos EPA+Dimarxou.
--
Quantifying time series differences
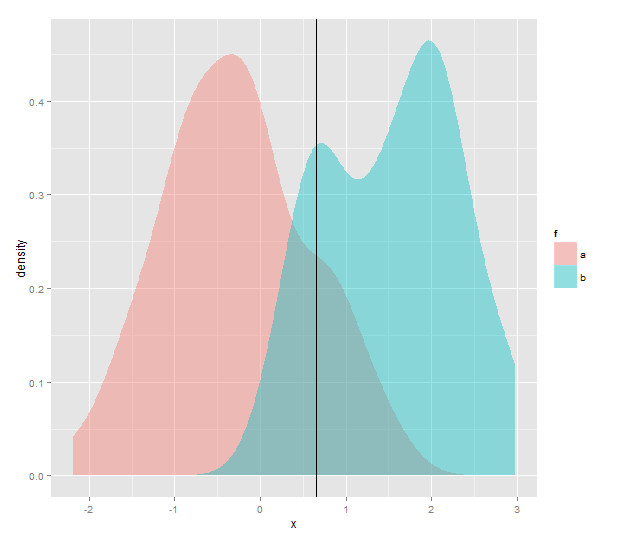
When it comes to comparing correlated time-series, the best is to compare their probabilistic distributions. The 3 graphs below represent the density distribution, CDF (cumulative distribution function) and QQ (using Volos EPA as the reference CDF). All those 3 graphs are based on the past 30 days time-series data, but you can also select a specific time range in the first time-series graphs, and those 3 graphs will be updated using the values from the given time range.
Looking at the probabilistic distribution with a naked eye, it is obvious that there is a big difference between Argonafton, Dimarxou and the reference Volos EPA station. It is worth noticing that there is a "bump" around AQI 150: The reason is that the distribution plot is based on the AQI rather than the raw concentration, and the more compact [150,200] AQI range (compared to [100,150]) make the AQI denser for >150 compared to <150.
When it comes to quantifying this difference, it is possible to use the concept of statistical distance to quantify the "goodness-of-fit". The most well-known distances are Kolmogorov-Smirnov, Wasserstein and Cramér-von Mises distances (for a good introduction about those distances, refer to this excellent explanations). The table below shows the distances based on the 30 days data (values will be updated if you select a time range from the main time-series graph).
| Station | | | | |
|---|
While the Kolmogorov-Smirnov distance does not correctly capture the relative distances (highlighting Dimarxou as far as Argonafton), both Wasserstein and Cramér-von Mises distances highlight an obvious larger distance for Argonafton. The values in the above table are based on the 30 days data. The 3 graphs below are based on the 7 days moving average for the past 30 days.
Those graphs do confirm that using either Wasserstein or Cramér-von distance, the distance from the Argonafton station and the Volos EPA is constantly at least twice more the distance that the other stations.
Correlating Meteorological Data
In order to confirm the hypothesis that the Argonafton station is producing abnormal and over-estimated concentration readings, we need to look at the meteorological data: The condition under which the Argonafton station could see higher concentration is when the wind is blowing from the south, i.e. where the wind would carry the cargo exhaust pipes fumes towards the station.
The first step is to check the average wind direction and speed during the past 30 days. The wind data is obtained from both the Volos Airport METAR station, as well as the Netatmo Tthiseos weather station. The two wind roses represent the number of times the wind is blowing in each direction.
Both wind roses plots show that the wind is mainly blowing from West or East and much less from the South. Since there are mountains on the northern part of Volos, there is substantially no wind below from the north.
Based on this empirical confirmation that the wind is blowing less from the south than other direction, it is not possible to deduct that the cargo exhaust pipes are the cause of the higher PM2.5 concentrations for the Argonafton station. This hypothesis is also invalidated by the correlation plot between 3 of the stations and the Airport wind-direction, which show that there is no clear evidence (for any of the stations) that southern wind implies high concentrations.
Last, we also need to check whether the issue with the Argonafton could be related to the relative humidity. The problem could be, for instance, due to higher humidity making the particle size larger and thus implying higher concentration. The correlation plot below confirms that this is not correct, as there is no clear evidence that concentration is proportional to the humidity.
Conclusion
In this article, we have been looking at the means of quantifying and qualifying the data quality for real-time stations. Assuming that there is a reference trusted station, we have shown that quantifying using either the Cramér-von Mises or Wasserstein distance can indicate issues with any station data.
We have also shown that distance in itself is not enough, and that to be more precise, the station context should be understood. such as its location and meteorological conditions. However, since the context is not something which can be automated, the final solution used for the WAQI project consist in qualifying station which statistical distances to the reference station is less than 1/4. This will be put in effect during the coming weeks (see aqicn.org/station/ for the real-time stations map.
This article is part of the series, and in the next article, we will be looking at means of qualifying station where no reference station is available.
--

