Introduction
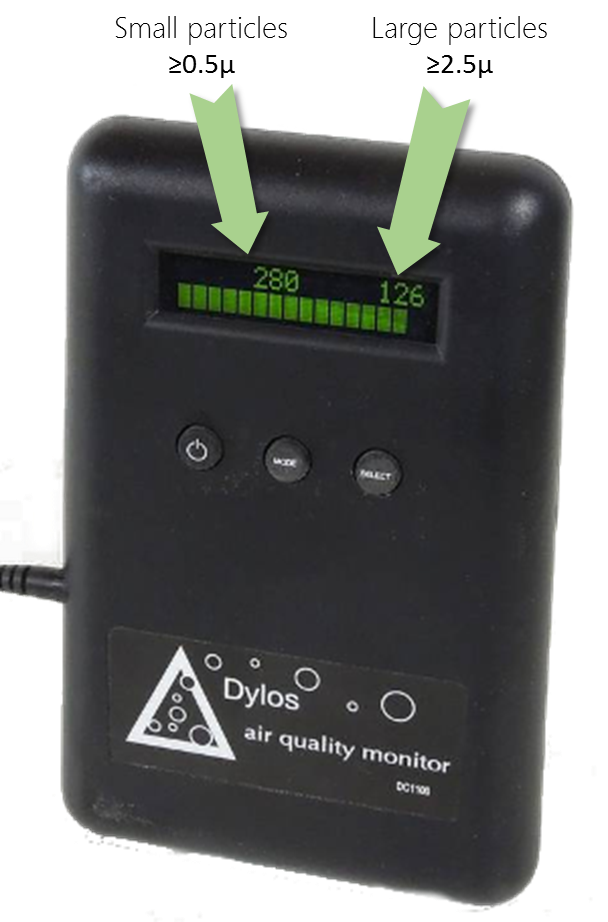
For more information about those real-time dylos and BAM monitor PM2.5 and PM10 readings, please refer to our article on the Dylos Air Particule Counter experimentation.
If you want to know about other affordarable Air Quality Sensors such as Shinyei and Samyoung, check our sensor overview page.
If you have a dylos monitor in shanghai, and want to join the experiment, just contact us and we will provide you the details to setup your equipment.
Time series graphs
Variation between stations
The next 2 graphics show the PM2.5 and PM10 raw values (in µg/m3) for different BAM stations (i.e. without the Dylos values) in Shanghai, for the last 15 days. This is provided to ensure that there is not significant devitation between the various stations, especially considering that some are located on the road side, while others are in the living area.
Shanghai Normal College (卢湾师专附小), BAM PM2.5 in µg/m3
US Consulate (上海美国总领事馆), BAM PM2.5 in µg/m3
--
For the list of all air quality sensors, check the Sensor Overview page
Read or publish comments (they rely on Disqus)
