The Plantower PMS5003 and PMS7003 Air Quality Sensor experiment

āĻļā§‡āĻ¯āĻŧāĻžāĻ° āĻ•āĻ°ā§āĻ¨: aqicn.org/sensor/pms5003-7003/bn/
For a complete list of all the Air Quality Sensors test on aqicn.org, check our sensor overview page.


PMS5003
PMS7003

Plantower PMS 5003 and PMS 7003 Sensor

The PMS 7003 and PMS 5003 sensors are the 7th resp 5th generation of the PMSx003 series developed by Plantower (chinese name æ”€č—¤).

Experiment Setup

For this experiment, 3 PMS 7003 and 3 PMS 5003 are co-located together. The objective is to understand the accuracy of individual sensor readings, and potential level of error induced by the lack of efficient calibration of low-cost sensors .

For each sensor (PMS5003 and PMS7003), there are 3 sensors (identified as PMSx003 #1, #2 and #3) running in alternation over a period of 3 minute. For each minute, only the last 30 seconds data is collected, as the first 30 seconds as kept to let the sensor stabilize its output.

There is additional PMS5003 sensor (number #4 ): It is a used (old) sensors which has been running in continuous mode for several months outdoor. The objective for this sensor is to understand if the accuracy decreases with the age (during to the laser or fan wearing off).

Specification sheets: PMS5003.pdf and PMS7003.pdf.

Note that the PMSx data from the Sensor comes in two flavors: '标准éĸ—į˛’į‰Š' (Standard Particles or CF-1, bytes 4-9) and '大气įŽ¯åĸƒä¸‹' (Atmospheric Environment, bytes 10-15). It is the second one which we use for this experiments (Thanks to Bart for the clarification).

Sensor tear-down

The following pictures are taken from a PMS5003 running for several months outdoor in continuous mode.


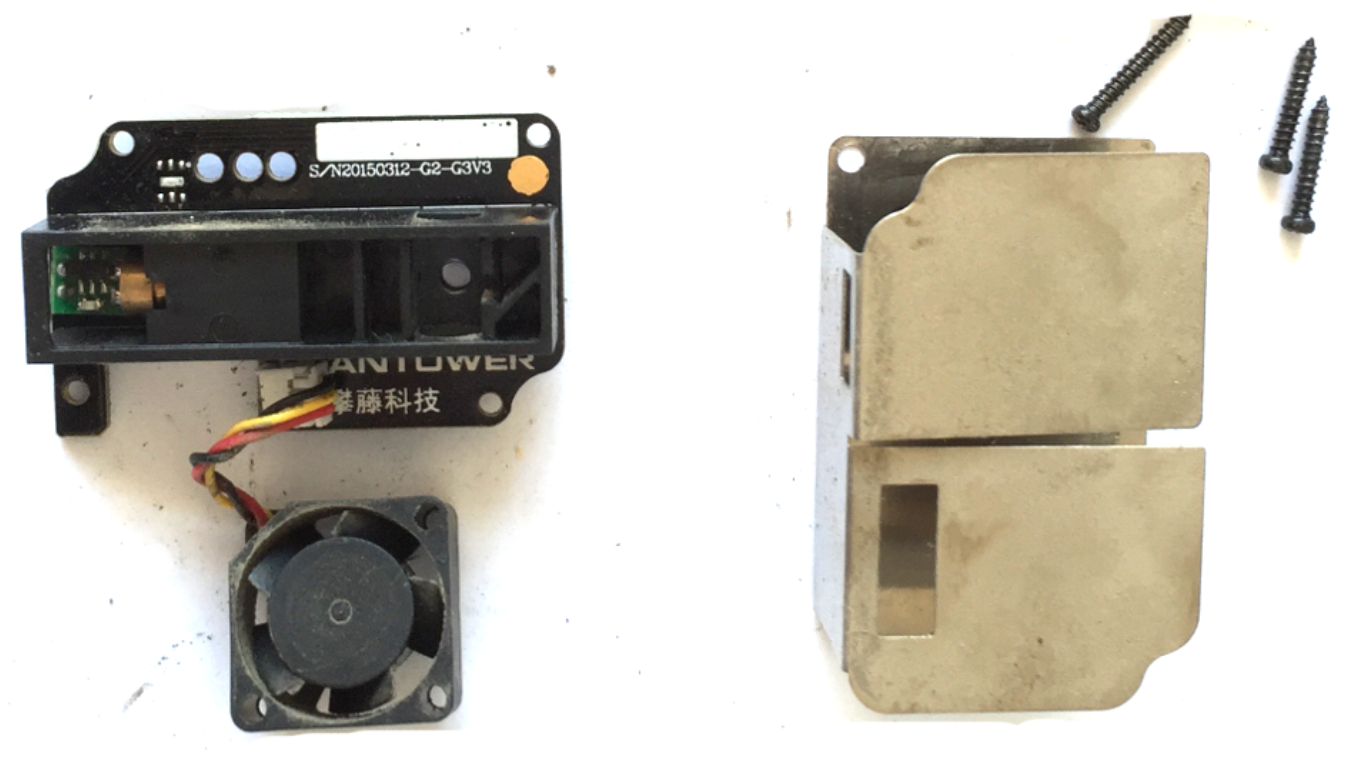
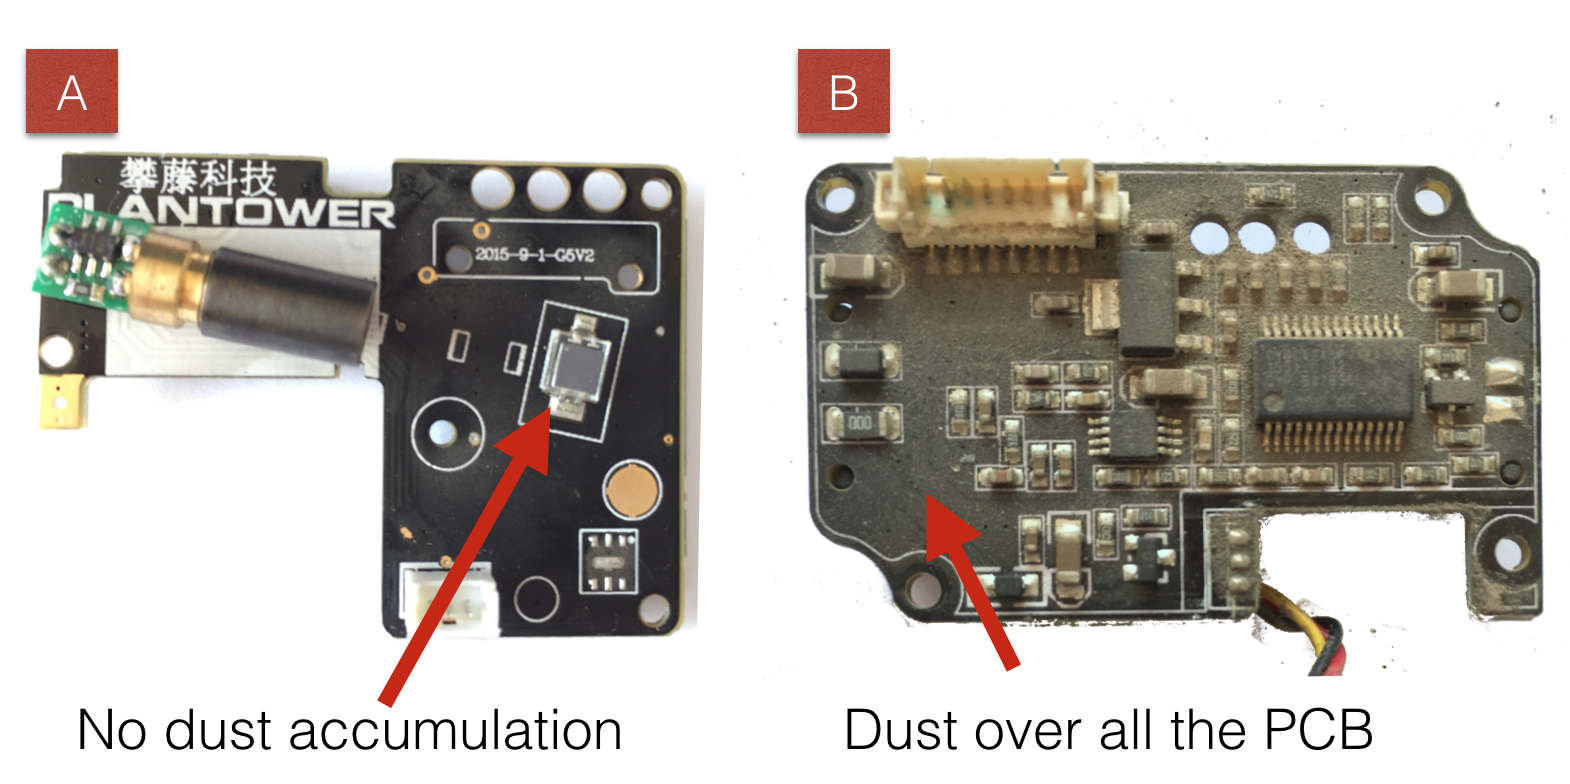
The good news is that Plantower managed to do a pretty good mechanical design which prevents dust accumulation on the front-side of the PCB (see image A on the right), where laser and diode are mounted. Compared to the dust accumulation on the Dylos, that guarantees a much better lifetime and data accuracy over time.

In terms of electrical and electronic components, the PMS5003 is not quite different from the initial PMS1003 desing. The CPU is still a Cypress CY8C4245, which a combined ARM Cortex-M0 running at 48Mhz with dedicated ADC, used to sample the output from the diode.

Real-time data

db stands for dust bin and is measured in counts per minute. For instance, db2.5-um represents the count of particles with an aerodynamic diameter below 2.5 Âĩm;

Time series for Meteorological Conditions

Meteorological conditions, and especially the Relative Humidity (RH) is needed as high RH might have a direct impact on the size of the particle size detected by the laser. For BAM sensors, there is actually a requirement for constant humidity.

Above graph is based on CWOP station EW2754. Below table is based on the real-time readings from our GAIA A12 station

Measurement: Temperature (in Celcius)
Ooops... Sorry, something wrong happenned
undefined
try again

Time series for Particulate Matter

Note that the first 3 time-series graphs are showing the values using AQI (and not raw mg/m3). The AQI is based on the US EPA breakpoints. For PM1, the PM2.5 breakpoints are used.

For the particulate matter graphs, the reference BAM measurements from the neighbor stations are shown, but not taken into account for the deviation plot ~ the aim of this experiments is to understand the deviation in between sensors of the same type (eg PMS) and not in between sensors using different technologies (eg Laser Counter vs Beta Attenuation).

The deviation plots below each time-series is computed as the difference between the minimum (in blue) resp. maximum (in red) value and the average reading for each 5 minute period block. The X axis is showing the average value, and the Y axis the difference between min/max and average. For the first 3 time-series graphs, the difference is expressed in AQI: This way, it is easy to asses the potential error in AQI value of those low-cost sensors.

Measurement: PM2.5 (AQI)
Sorry, something wrong happened...
Measurement: PM10 (AQI)

Comparison between Std. Particle (标准éĸ—į˛’į‰Š) and Std. Atmosphere (大气įŽ¯åĸƒä¸‹)

CF1 refers to Std. Particle (标准éĸ—į˛’į‰Š). SAT refers to Std. Atmosphere (大气įŽ¯åĸƒä¸‹).

The graphs below shows the correlation for the CF1 (X, absyss) and the ratio CF1/SAT (Y, ordinate), for the PM2.5 and PM10 data.


The almost too perfect correlation between approx. 30 mg to 100 mg for PM2.5 / PMS5003, (40mg to 150 for PM10) does not sound too scientific...

cf1<30 ⇒ sat=cf1
cf1>100 ⇒ sat = cf1 * 2/3
cf1 in ∈ [30;100] ⇒ sat = 30 + cf1 * (cf1-30)/70 * 2/3

Note: Thanks to Bart for the comment on `CF1>30 ⇒ SAT < CF1`
The formula has been updated with correct ratio (2/3)

One interesting question is whether is CF-1/SAT ratio is part of the calibration process done by Plantower; At least, for PM2.5 the upper threshold for PMS7003 and PMS5003 are different (85 for the first, and 100 for the second). When sufficient data is available, this page will be updated with the answer...

Correlation between PM10 and PM2.5

Refering to the experiment on PM10 vs PM2.5, the question is weather the PMS sensor is able to correctly detect the particules. The graph below show the correlation between PM10 vs PM2.5 CF-1 readings for the past 10 days.


For now, the correlation seems perfectly linear, but as soon as the next PM10 pollution event comes, the graph will be able to confirm the efficiency of bin size detection.

Moreover, one interesting pattern to check for is the non-linear curve, which can be seen on the Dylos sensor. This curved pattern is due to the sensor not beeing able to properly detect the different particles bins, caused by a too high number of particles 'obstructing' the diode. For now, the Air Pollution is too low to detect this phenomenon, but as soon as winter arrives, the data will confirm the existence of this pattern or not.

Time series for Particulate Matter (Indoor setup)

There are 2 additional indoor PMS5003 sensors:
The graphs below are expressed in AQI units.
Measurement: PM2.5 (in AQI units)
Ooops... Sorry, something wrong happenned
undefined
try again
And this is for the meteorological indoor sensor
Measurement: Temperature (in Celcius)
Ooops... Sorry, something wrong happenned
undefined
try again


- -

For the list of all air quality sensors, check the Sensor Overview page

Read or publish comments (they rely on Disqus)

āĻŦāĻžāĻ¯āĻŧā§āĻ° āĻ—ā§āĻŖāĻŽāĻžāĻ¨ āĻāĻŦāĻ‚ āĻĻā§‚āĻˇāĻŖ āĻĒāĻ°āĻŋāĻŽāĻžāĻĒ āĻ¸āĻŽā§āĻĒāĻ°ā§āĻ•ā§‡:

āĻāĻ¯āĻŧāĻžāĻ° āĻ•ā§‹āĻ¯āĻŧāĻžāĻ˛āĻŋāĻŸāĻŋ āĻ˛ā§‡āĻ­ā§‡āĻ˛ āĻ¸āĻŽā§āĻĒāĻ°ā§āĻ•ā§‡

- āĻāĻ¯āĻŧāĻžāĻ° āĻ•ā§‹āĻ¯āĻŧāĻžāĻ˛āĻŋāĻŸāĻŋ āĻ‡āĻ¨āĻĄā§‡āĻ•ā§āĻ¸ (AQI) āĻŽāĻžāĻ¨āĻ¸ā§āĻŦāĻžāĻ¸ā§āĻĨā§āĻ¯ āĻ‰āĻĻā§āĻŦā§‡āĻ—ā§‡āĻ° āĻ¸ā§āĻ¤āĻ°
0 - 50 āĻ­āĻžāĻ˛ āĻŦāĻžāĻ¯āĻŧā§ āĻŽāĻžāĻ¨āĻ•ā§‡ āĻ¸āĻ¨ā§āĻ¤ā§‹āĻˇāĻœāĻ¨āĻ• āĻŦāĻ˛ā§‡ āĻŽāĻ¨ā§‡ āĻ•āĻ°āĻž āĻšāĻšā§āĻ›ā§‡, āĻāĻŦāĻ‚ āĻŦāĻžāĻ¯āĻŧā§ āĻĻā§‚āĻˇāĻŖā§‡āĻ° āĻœāĻ¨ā§āĻ¯ā§‡ āĻ…āĻ¤āĻŋ āĻ¸āĻžāĻŽāĻžāĻ¨ā§āĻ¯ āĻŦāĻž āĻ•ā§‹āĻ¨ āĻā§āĻāĻ•āĻŋāĻ‡ āĻĨāĻžāĻ•āĻ›ā§‡ āĻ¨āĻž
51 -100 āĻŽāĻ§ā§āĻ¯āĻĒāĻ¨ā§āĻĨā§€ āĻŦāĻžā§Ÿā§āĻ° āĻŽāĻžāĻ¨ āĻ—ā§āĻ°āĻšāĻŖāĻ¯ā§‹āĻ—ā§āĻ¯; āĻ•āĻŋāĻ¨ā§āĻ¤ā§, āĻ•āĻŋāĻ›ā§ āĻĻā§‚āĻˇāĻŖāĻ•āĻžāĻ°āĻ•ā§‡āĻ° āĻœāĻ¨ā§āĻ¯ āĻ–ā§āĻŦ āĻ•āĻŽ āĻ¸āĻ‚āĻ–ā§āĻ¯āĻ• āĻŽāĻžāĻ¨ā§āĻˇā§‡āĻ° āĻĒāĻ•ā§āĻˇā§‡ āĻ¸āĻžāĻŽāĻžāĻ¨ā§āĻ¯ āĻ¸ā§āĻŦāĻžāĻ¸ā§āĻĨā§āĻ¯ā§‡āĻ° āĻ‰āĻĻā§āĻŦā§‡āĻ— āĻĨāĻžāĻ•āĻ¤ā§‡ āĻĒāĻžāĻ°ā§‡ āĻ¯āĻžāĻ°āĻž āĻŦāĻžāĻ¯āĻŧā§ āĻĻā§‚āĻˇāĻŖā§‡āĻ° āĻœāĻ¨ā§āĻ¯ āĻ…āĻ¸ā§āĻŦāĻžāĻ­āĻžāĻŦāĻŋāĻ• āĻ­āĻžāĻŦā§‡ āĻ¸āĻ‚āĻŦā§‡āĻĻāĻ¨āĻļā§€āĻ˛āĨ¤
101-150 āĻ…āĻ¸ā§āĻŦāĻžāĻ¸ā§āĻĨā§āĻ¯āĻ•āĻ° āĻ¸āĻ‚āĻŦā§‡āĻĻāĻ¨āĻļā§€āĻ˛ āĻ—ā§āĻ°ā§āĻĒā§‡āĻ° āĻ¸āĻ‚āĻŦā§‡āĻĻāĻ¨āĻļā§€āĻ˛ āĻ—ā§āĻ°ā§āĻĒā§‡āĻ° āĻ¸āĻĻāĻ¸ā§āĻ¯āĻ°āĻž āĻ¸ā§āĻŦāĻžāĻ¸ā§āĻĨā§āĻ¯ā§‡āĻ° āĻĒā§āĻ°āĻ­āĻžāĻŦ āĻĢā§‡āĻ˛āĻ¤ā§‡ āĻĒāĻžāĻ°ā§‡āĨ¤ āĻ¸āĻžāĻ§āĻžāĻ°āĻŖ āĻœāĻ¨āĻ—āĻŖ āĻĒā§āĻ°āĻ­āĻžāĻŦāĻŋāĻ¤ āĻšāĻ¤ā§‡ āĻĒāĻžāĻ°ā§‡ āĻ¨āĻžāĨ¤
151-200 āĻ…āĻ¸ā§āĻŦāĻžāĻ¸ā§āĻĨā§āĻ¯āĻ•āĻ° āĻĒā§āĻ°āĻ¤ā§āĻ¯ā§‡āĻ•ā§‡āĻ°āĻ‡ āĻ¸ā§āĻŦāĻžāĻ¸ā§āĻĨā§āĻ¯ā§‡āĻ° āĻ“āĻĒāĻ° āĻĒā§āĻ°āĻ­āĻžāĻŦ āĻĒāĻĄāĻŧāĻ¤ā§‡ āĻļā§āĻ°ā§ āĻšāĻ¤ā§‡ āĻĒāĻžāĻ°ā§‡; āĻ¸āĻ‚āĻŦā§‡āĻĻāĻ¨āĻļā§€āĻ˛ āĻ—ā§āĻ°ā§āĻĒā§‡āĻ° āĻ¸āĻĻāĻ¸ā§āĻ¯āĻ°āĻž āĻ†āĻ°āĻ“ āĻ—ā§āĻ°ā§āĻ¤āĻ° āĻ¸ā§āĻŦāĻžāĻ¸ā§āĻĨā§āĻ¯ā§‡āĻ° āĻ“āĻĒāĻ° āĻĒā§āĻ°āĻ­āĻžāĻŦ āĻ…āĻ¨ā§āĻ­āĻŦ āĻ•āĻ°āĻ¤ā§‡ āĻĒāĻžāĻ°ā§‡āĻ¨āĨ¤
201-300 āĻ–ā§āĻŦ āĻ…āĻ¸ā§āĻŦāĻžāĻ¸ā§āĻĨā§āĻ¯āĻ•āĻ° āĻœāĻ°ā§āĻ°āĻŋ āĻ…āĻŦāĻ¸ā§āĻĨāĻž āĻ¸ā§āĻŦāĻžāĻ¸ā§āĻĨā§āĻ¯ āĻ¸āĻ¤āĻ°ā§āĻ•āĻ¤āĻžāĨ¤ āĻ¸āĻŽāĻ—ā§āĻ° āĻœāĻ¨āĻ¸āĻ‚āĻ–ā§āĻ¯āĻžāĻ° āĻĒā§āĻ°āĻ­āĻžāĻŦāĻŋāĻ¤ āĻšāĻ¤ā§‡ āĻĒāĻžāĻ°ā§‡āĨ¤
300+ āĻŦāĻŋāĻĒāĻœā§āĻœāĻ¨āĻ• āĻ¸ā§āĻŦāĻžāĻ¸ā§āĻĨā§āĻ¯ āĻ¸āĻ¤āĻ°ā§āĻ•āĻ¤āĻž: āĻĒā§āĻ°āĻ¤ā§āĻ¯ā§‡āĻ•ā§‡āĻ°āĻ‡ āĻ†āĻ°āĻ“ āĻ—ā§āĻ°ā§āĻ¤āĻ° āĻ¸ā§āĻŦāĻžāĻ¸ā§āĻĨā§āĻ¯ā§‡āĻ° āĻĒā§āĻ°āĻ­āĻžāĻŦ āĻĒāĻĄāĻŧāĻ¤ā§‡ āĻĒāĻžāĻ°ā§‡

āĻŦāĻžāĻ¯āĻŧā§āĻ° āĻ—ā§āĻŖāĻŽāĻžāĻ¨ āĻāĻŦāĻ‚ āĻĻā§‚āĻˇāĻŖ āĻ¸āĻŽā§āĻĒāĻ°ā§āĻ•ā§‡ āĻ†āĻ°āĻ“ āĻœāĻžāĻ¨āĻ¤ā§‡, āĻ‰āĻ‡āĻ•āĻŋāĻĒāĻŋāĻĄāĻŋāĻ¯āĻŧāĻž āĻāĻ¯āĻŧāĻžāĻ° āĻ•ā§‹āĻ¯āĻŧāĻžāĻ˛āĻŋāĻŸāĻŋ āĻŦāĻŋāĻˇāĻ¯āĻŧ āĻŦāĻž āĻŦāĻžāĻ¯āĻŧā§āĻ° āĻ—ā§āĻŖāĻŽāĻžāĻ¨ āĻāĻŦāĻ‚ āĻ†āĻĒāĻ¨āĻžāĻ° āĻ¸ā§āĻŦāĻžāĻ¸ā§āĻĨā§āĻ¯ā§‡āĻ° āĻœāĻ¨ā§āĻ¯ āĻāĻ¯āĻŧāĻžāĻ°āĻ¨āĻžāĻ‰ āĻ—āĻžāĻ‡āĻĄ āĻĻā§‡āĻ–ā§āĻ¨āĨ¤

āĻŦā§‡āĻ‡āĻœāĻŋāĻ‚ āĻĄāĻžāĻ•ā§āĻ¤āĻžāĻ° āĻ°āĻŋāĻšāĻžāĻ°ā§āĻĄ āĻ¸ā§‡āĻ¨ā§āĻŸ āĻ¸āĻžāĻ‡āĻ° āĻāĻŽāĻĄāĻŋāĻ° āĻ–ā§āĻŦ āĻĻāĻ°āĻ•āĻžāĻ°ā§€ āĻ¸ā§āĻŦāĻžāĻ¸ā§āĻĨā§āĻ¯ āĻĒāĻ°āĻžāĻŽāĻ°ā§āĻļā§‡āĻ° āĻœāĻ¨ā§āĻ¯, www.myhealthbeijing.com āĻŦā§āĻ˛āĻ— āĻĻā§‡āĻ–ā§āĻ¨āĨ¤


āĻŦā§āĻ¯āĻŦāĻšāĻžāĻ°ā§‡āĻ° āĻ¨ā§‹āĻŸāĻŋāĻļ: āĻĒā§āĻ°āĻ•āĻžāĻļāĻ¨āĻžāĻ° āĻ¸āĻŽāĻ¯āĻŧ āĻ¸āĻŽāĻ¸ā§āĻ¤ āĻŦāĻžāĻ¯āĻŧā§ āĻ—ā§āĻŖāĻŽāĻžāĻ¨ āĻ¤āĻĨā§āĻ¯ āĻ…-āĻŦā§ˆāĻ§ āĻšāĻ¯āĻŧ āĻāĻŦāĻ‚ āĻ—ā§āĻŖāĻŽāĻžāĻ¨ āĻ¨āĻŋāĻļā§āĻšāĻŋāĻ¤āĻ•āĻ°āĻŖā§‡āĻ° āĻ•āĻžāĻ°āĻŖā§‡ āĻāĻ‡ āĻ¤āĻĨā§āĻ¯āĻŸāĻŋ āĻ¯ā§‡ āĻ•ā§‹āĻ¨āĻ“ āĻ¸āĻŽāĻ¯āĻŧā§‡ āĻ¨ā§‹āĻŸāĻŋāĻļ āĻ›āĻžāĻĄāĻŧāĻžāĻ‡ āĻ¸āĻ‚āĻļā§‹āĻ§āĻ¨ āĻ•āĻ°āĻž āĻ¯ā§‡āĻ¤ā§‡ āĻĒāĻžāĻ°ā§‡āĨ¤ āĻ“āĻ¯āĻŧāĻžāĻ°ā§āĻ˛ā§āĻĄ āĻāĻ¯āĻŧāĻžāĻ° āĻ•ā§‹āĻ¯āĻŧāĻžāĻ˛āĻŋāĻŸāĻŋ āĻ‡āĻ¨āĻĄā§‡āĻ•ā§āĻ¸ āĻĒā§āĻ°āĻ•āĻ˛ā§āĻĒāĻŸāĻŋ āĻāĻ‡ āĻ¤āĻĨā§āĻ¯āĻ—ā§āĻ˛āĻŋāĻ° āĻ¸āĻžāĻŽāĻ—ā§āĻ°ā§€āĻ° āĻŽāĻ§ā§āĻ¯ā§‡ āĻ•āĻŽā§āĻĒāĻžāĻ‡āĻ˛ āĻ•āĻ°āĻžāĻ° āĻœāĻ¨ā§āĻ¯ āĻ¸āĻŽāĻ¸ā§āĻ¤ āĻ¯ā§āĻ•ā§āĻ¤āĻŋāĻ¸āĻ™ā§āĻ—āĻ¤ āĻĻāĻ•ā§āĻˇāĻ¤āĻž āĻ“ āĻ¯āĻ¤ā§āĻ¨ āĻŦā§āĻ¯āĻŦāĻšāĻžāĻ° āĻ•āĻ°ā§‡āĻ›ā§‡ āĻāĻŦāĻ‚ āĻ•ā§‹āĻ¨āĻ“ āĻĒāĻ°āĻŋāĻ¸ā§āĻĨāĻŋāĻ¤āĻŋāĻ¤ā§‡ āĻāĻŸāĻŋ āĻ“āĻ¯āĻŧāĻžāĻ°ā§āĻ˛ā§āĻĄ āĻāĻ¯āĻŧāĻžāĻ° āĻ•ā§‹āĻ¯āĻŧāĻžāĻ˛āĻŋāĻŸāĻŋ āĻ‡āĻ¨āĻĄā§‡āĻ•ā§āĻ¸ āĻĒā§āĻ°āĻ•āĻ˛ā§āĻĒ āĻĻāĻ˛ āĻŦāĻž āĻ¤āĻžāĻ° āĻāĻœā§‡āĻ¨ā§āĻŸāĻ—ā§āĻ˛āĻŋ āĻāĻ‡ āĻ¤āĻĨā§āĻ¯ āĻ¸āĻ°āĻŦāĻ°āĻžāĻš āĻĨā§‡āĻ•ā§‡ āĻ¸āĻ°āĻžāĻ¸āĻ°āĻŋ āĻŦāĻž āĻĒāĻ°ā§‹āĻ•ā§āĻˇāĻ­āĻžāĻŦā§‡ āĻ‰āĻĻā§āĻ­ā§‚āĻ¤ āĻ•ā§‹āĻ¨ āĻ•ā§āĻˇāĻ¤āĻŋ, āĻ†āĻ˜āĻžāĻ¤ āĻŦāĻž āĻ•ā§āĻˇāĻ¤āĻŋāĻ° āĻœāĻ¨ā§āĻ¯ āĻšā§āĻ•ā§āĻ¤āĻŋ, āĻ¨āĻŋāĻ°ā§āĻ¯āĻžāĻ¤āĻ¨ āĻŦāĻž āĻ…āĻ¨ā§āĻ¯āĻĨāĻžāĻ¯āĻŧ āĻĻāĻžāĻ¯āĻŧāĻŦāĻĻā§āĻ§āĨ¤


Settings


Language Settings:


Temperature unit:
Celcius