Introduction
更多有关Dylos和BAM检测器的PM2.5与PM10读数的相关信息,请参考 Dylos 空气微粒计数器实验,第一部分.
If you want to know about other affordarable Air Quality Sensors such as Shinyei and Samyoung, check our sensor overview page. Those two graphs show the last 15 days data correlation for the Dylos monitor from vozduh.msk.ru (in blue) and BAM monitor from Glebovskaya, moscow (in red).
Note that the BAM data is very noisy, at least when comparing to the quite regular BAM data from Beijing, which suggest that the station might not be that as well maintained as it could. For this reason, each hourly value is averaged based on the last 3 hours reading.
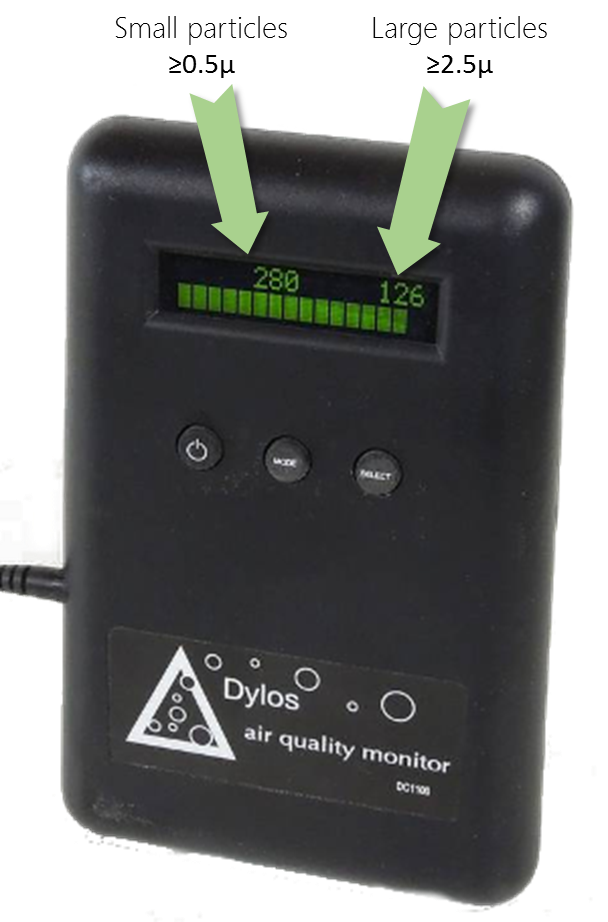
PM2.5 time graph (BAM, PM2.5 in µg/m3, Dylos ≥0.5µ particules count) PM2.5 BAM and Dylos correlation graph. PM10 time graph (BAM, PM10 in µg/m3, Dylos ≥2.5µ particules count) PM10 BAM and Dylos correlation graph.
--
Real-time readings
Current dylos readings are: Particules larger than 0.5 is -, larger than 2.5 is -, updated on - - (Moscow time).
Time graph
Note that the BAM data is very noisy, at least when comparing to the quite regular BAM data from Beijing, which suggest that the station might not be that as well maintained as it could. For this reason, each hourly value is averaged based on the last 3 hours reading.
--
For the list of all air quality sensors, check the Sensor Overview page
Read or publish comments (they rely on Disqus)
