Introduction
更多有关Dylos和BAM检测器的PM2.5与PM10读数的相关信息,请参考 Dylos 空气微粒计数器实验,第一部分.
If you want to know about other affordarable Air Quality Sensors such as Shinyei and Samyoung, check our sensor overview page.
Real-time data from Beijing, Haidian district
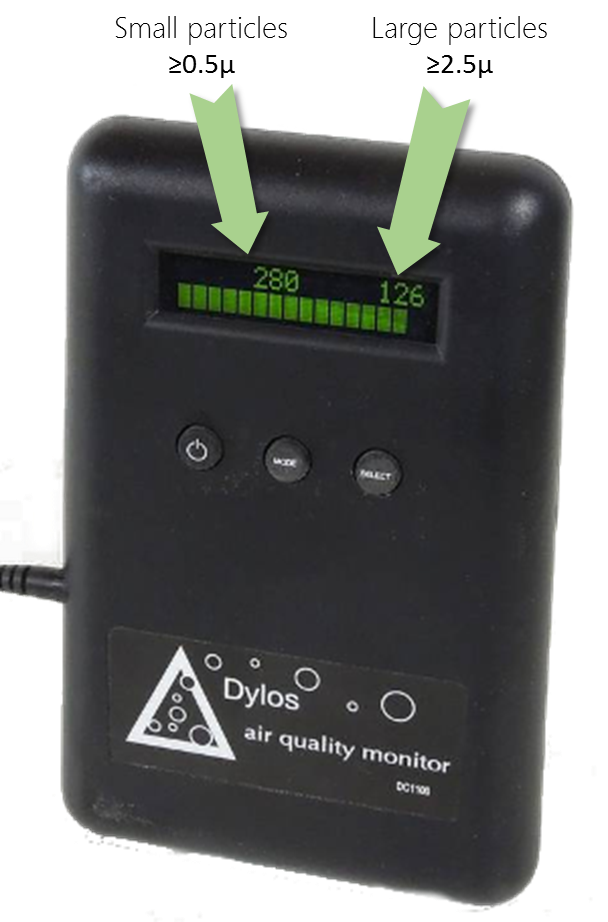
Current dylos readings are: larger than 2.5 is -, larger than 0.5 is -, updated on - - (GMT+8).
Those values are expressed in number of particules per 0.01 cubic foot (100.n/ft3), i.e. same as what is displayed on the Dylos LCD. The Haidian Dylos station is maintained by Fred C.
Time series graphs
Note that the comparison between Dylos and BAM readings is done for Dylos ≥ 0.5u with PM2.5 and Dylos ≥ 2.5u with PM10. You might think that comparing readings for Dylos ≥ 2.5u and PM2.5 might be more relevant, but this is actually not the case. The explanation is given in the experiment ' what is the dylos monitor actually measuring'.
Variation between stations
The next 2 graphics show the PM2.5 and PM10 raw values (in µg/m3) for different BAM stations (i.e. without the Dylos values) in Beijing, for the last 10 days. This is provided to ensure that there is not significant devitation between the various stations, especially considering that some are located on the road side, while others are in the living area.
--
For the list of all air quality sensors, check the Sensor Overview page
Read or publish comments (they rely on Disqus)
