The colors used for PM2.5, PM10 and Ozone (O3) are based on the US EPA standard. The colors used for Nitrogen Dioxide (NO2), Sulphur Dioxide (SO2) and Carbon Monoxide (CO) are based on an arbitrary color standard which best matches the concentration range. It does not have any relation with the AQI breakpoints, as in most cases, the AQI for those 3 gases is most often below 50.
The scale for the color range below is expressed in raw concentration (in mg/m3).
How accurate are the forecasts?
Check the correlation graphs below for PM2.5, PM10 and Ozone for the past 30 days.
(Note that by default, all values below are expressed in AQI (without averaging), and that forecast values are based on the the forecast computed today for tomorrow, i.e. based on the 24H-48H forecast range).
Note: The convertion from ppm to mg/m3 for the Ozone is based on the STP US standard.
For a comparative analysis several Air Quality Forecast models applied to Beijing, check the forecast/Beijing page.
For a full list of all Air Quality Forecast models being analyzed, check the forecast models page:
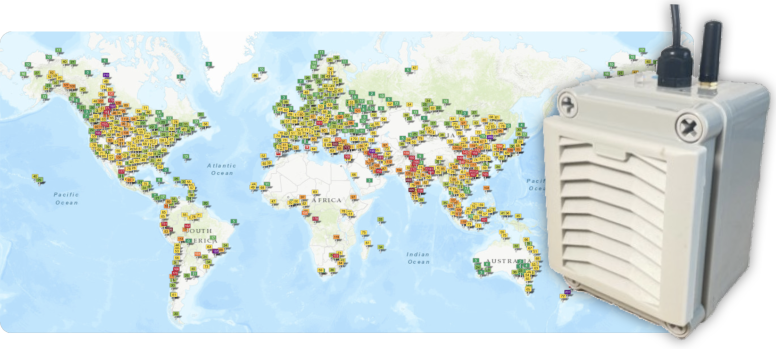
aqicn.org/forecast/models/Our GAIA air quality monitors are very easy to set up: You only need a WIFI access point and a USB compatible power supply.
Once connected, your real time air pollution levels are instantaneously available on the maps and through the API.
The station comes with a 10-meter water-proof power cable, a USB power supply, mounting equipment and an optional solar panel.
We need your help
Help is needed for keeping the world-wide Air Quality forecast model inventory up-to-date.
If yes, send us a message with the form below and we will contact you asap!
This forecasting model, and all AQFS which it is based on, are research products intended to provide information related to Air Quality forecast. All reasonable measures have been taken to ensure its quality and accuracy. However:
For more information about the underlying concepts of Air Quality forecasting (or Atmospheric Dispersion Modeling), check the article on a visual study of wind impact of PM2.5 concentration.
AQI | Air Pollution Level | Health Implications | Cautionary Statement (for PM2.5) |
0 - 50 | Good | Air quality is considered satisfactory, and air pollution poses little or no risk | None |
51 -100 | Moderate | Air quality is acceptable; however, for some pollutants there may be a moderate health concern for a very small number of people who are unusually sensitive to air pollution. | Active children and adults, and people with respiratory disease, such as asthma, should limit prolonged outdoor exertion. |
101-150 | Unhealthy for Sensitive Groups | Members of sensitive groups may experience health effects. The general public is not likely to be affected. | Active children and adults, and people with respiratory disease, such as asthma, should limit prolonged outdoor exertion. |
151-200 | Unhealthy | Everyone may begin to experience health effects; members of sensitive groups may experience more serious health effects | Active children and adults, and people with respiratory disease, such as asthma, should avoid prolonged outdoor exertion; everyone else, especially children, should limit prolonged outdoor exertion |
201-300 | Very Unhealthy | Health warnings of emergency conditions. The entire population is more likely to be affected. | Active children and adults, and people with respiratory disease, such as asthma, should avoid all outdoor exertion; everyone else, especially children, should limit outdoor exertion. |
300+ | Hazardous | Health alert: everyone may experience more serious health effects | Everyone should avoid all outdoor exertion |