مؤشر جودة الهواء (AQI) لـ 余杭镇一中, Hangzhou.: مؤشر جودة الهواء في الوقت الفعلي (AQI) في 余杭镇一中, Hangzhou. |
- | غير متاح Updated on Sunday, Oct 2nd 2022 درجة حرارة: -°C |
| حاضِر | اليومين الماضيين | دقيقة | الأعلى | |
PM2.5 AQI | - | 70 | 112 | |
PM10 AQI | - | 30 | 61 | |
O3 AQI | - | 4 | 109 | |
NO2 AQI | - | 5 | 17 | |
SO2 AQI | - | 3 | 5 | |
CO AQI | - | 6 | 9 | |
Temp | - | 24 | 37 | |
Pressure | - | 1009 | 1014 | |
Humidity | - | 41 | 97 | |
Wind | - | 0 | 5 | |
توقعات جودة الهواء
بيانات جودة الهواء مقدمة من: the Zhejiang Environmental Protection Bureau (浙江省环保厅门户) (sthjt.zj.gov.cn)
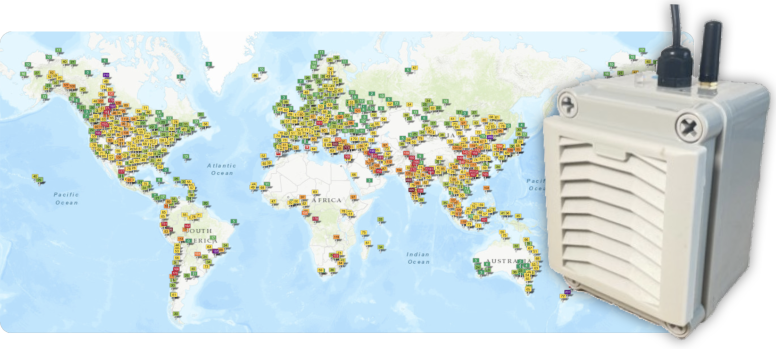
هل تعرف أي محطات لقياس جودة الهواء في منطقتك؟ لماذا لا تشارك في الخريطة بمحطة جودة الهواء الخاصة بك؟
> aqicn.org/gaia/ <
يشارك: “ما مدى تلوث الهواء اليوم؟ اطلع على خريطة تلوث الهواء في الوقت الفعلي لأكثر من 100 دولة.”
Share: “تلوث الهواء في 余杭镇一中, Hangzhou: مؤشر جودة الهواء في الوقت الفعلي (AQI)”
Cloud API
يمكن الوصول إلى البيانات في الوقت الفعلي لمحطة مراقبة جودة الهواء برمجيًا باستخدام عنوان URL لواجهة برمجة التطبيقات هذا:(لمزيد من المعلومات، راجع صفحة API:aqicn.org/api/ or aqicn.org/data-platform/api/H4751)
