Industrial Area, Hajipur空气污染:实时空气质量指数(AQI)


Industrial Area, Hajipur AQI: Industrial Area, Hajipur实时空气质量指数(AQI)。
194
中度污染
更新时间 星期二7:00
温度: 13°C
当前的过去 2 天分钟最大限度
PM2.5 AQI
194Industrial Area, Hajipur, 印度 PM25 (小颗粒物)  measured by CPCB - India Central Pollution Control Board.
Values are converted to the US EPA AQI standard.132240
PM10 AQI
120Industrial Area, Hajipur, 印度 PM10 (可吸入颗粒物)  measured by CPCB - India Central Pollution Control Board.
Values are converted to the US EPA AQI standard.75222
O3 AQI
3Industrial Area, Hajipur, 印度 O3 (臭氧)  measured by CPCB - India Central Pollution Control Board.
Values are converted to the US EPA AQI standard.346
NO2 AQI
20Industrial Area, Hajipur, 印度 NO2 (二氧化氮)  measured by CPCB - India Central Pollution Control Board.
Values are converted to the US EPA AQI standard.1234
SO2 AQI
1Industrial Area, Hajipur, 印度 SO2 (二氧化硫)  measured by CPCB - India Central Pollution Control Board.
Values are converted to the US EPA AQI standard.13
CO AQI
5Industrial Area, Hajipur, 印度 CO (一氧化碳)  measured by CPCB - India Central Pollution Control Board.
Values are converted to the US EPA AQI standard.015
温度。
13Industrial Area, Hajipur, 印度  t (温度。)  measured by Citizen Weather Observer Program (CWOP/APRS).1224
空气压力
756Industrial Area, Hajipur, 印度  p (空气压力:)  measured by Citizen Weather Observer Program (CWOP/APRS).755757
湿度
96Industrial Area, Hajipur, 印度  h (湿度)  measured by Citizen Weather Observer Program (CWOP/APRS).3696
0Industrial Area, Hajipur, 印度  w (风)  measured by Citizen Weather Observer Program (CWOP/APRS).01

空气质量预报

空气质量数据提供者: CPCB - India Central Pollution Control Board (cpcb.nic.in)

您知道您所在地区的任何空气质量站吗? 为什么不将自己的空气质量站纳入地图呢?
了解更多信息
> aqicn.org/gaia/ <
分享: “如何为今天的空气污染?实时空气污染的数据 - 超过100个国家在世界上。
https://aqicn.org/here/cn/
分享: “Industrial Area, Hajipur, 印度的空气污染指数是中度污染 - 2025年1月28日, 07:00

News (January 8th): Noticed a change in AQI values? The Air Quality Scale in use has been updatedto align with the USEPA Standard.
For more information, please thisrefer to article about the National Air Quality Standard
Cloud API
可以使用以下 API URL 以编程方式访问此空气质量监测站的实时数据:(欲了解更多信息,请查看 API 页面:aqicn.org/api/ or aqicn.org/data-platform/api/H12818)

寻找其他的城市?


您知道您所在地区的任何空气质量站吗?
为什么不将自己的空气质量站纳入地图呢?

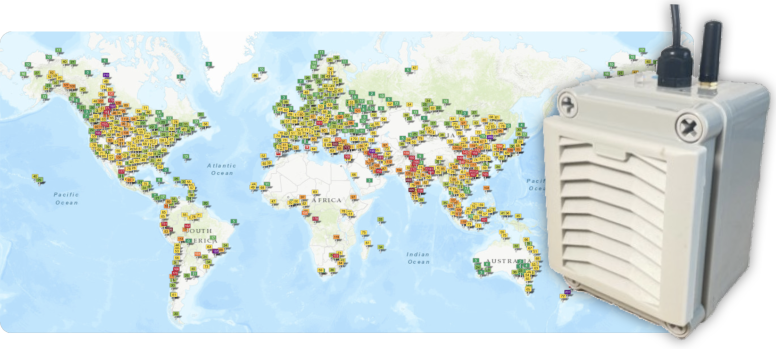
我们的 GAIA 空气质量监测器设置非常容易:您只需要一个 WIFI 接入点和一个 USB 兼容电源。

一旦连接,您的实时空气污染水平将立即在地图上和通过 API 显示。

该站配备 10 米防水电源线、USB 电源、安装设备和可选太阳能电池板。

空气质量历史数据。


空气质量最差城市排名

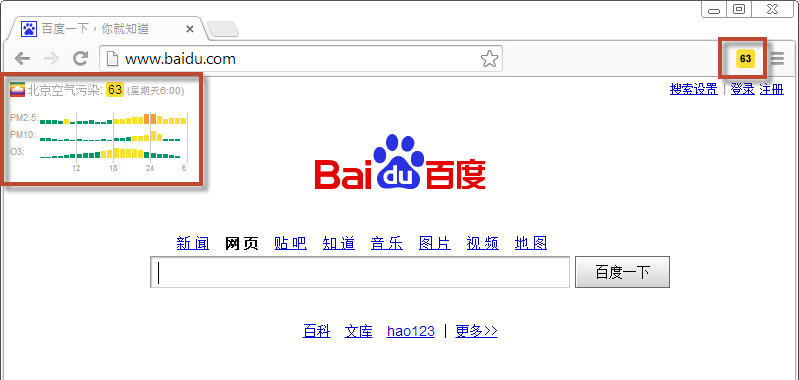
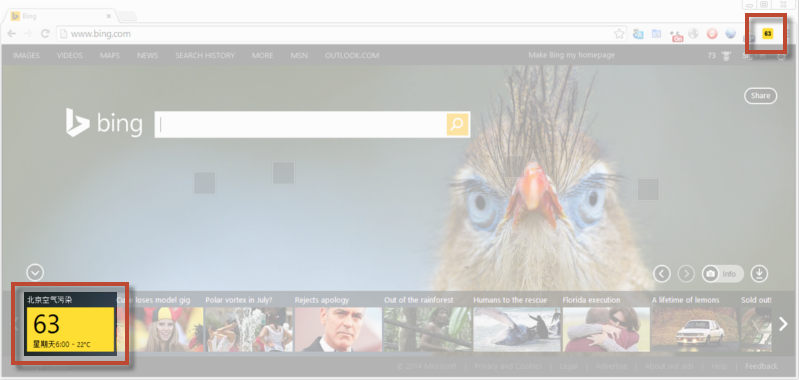
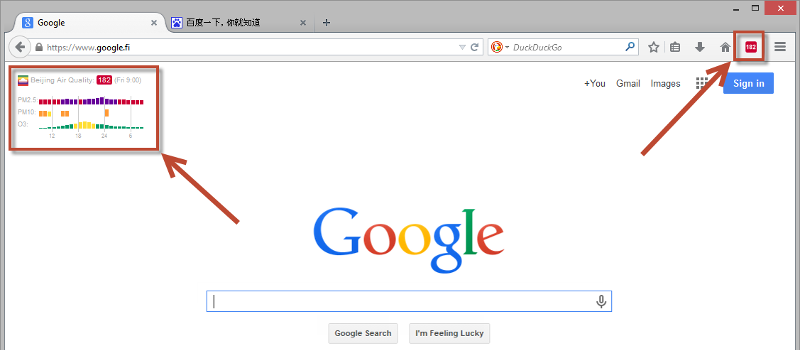
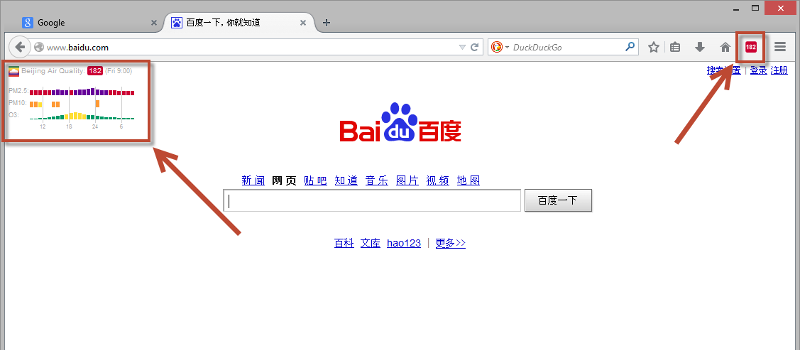
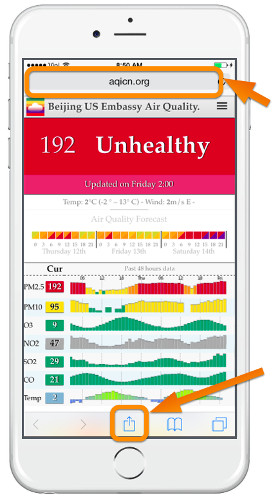
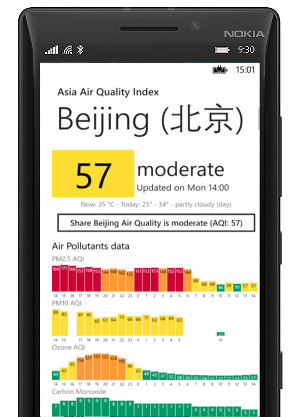
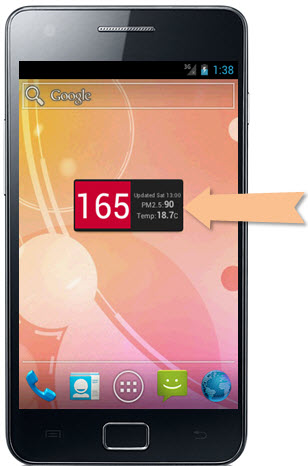
下载 及时更新 空气质量指数 插件


iPhone & iPad
Android
Windows Phone
Windows PC
Google Chrome
Firefox
Wordpress
Cloud API


寻找更多空气质量相关产品?


关于空气质量与空气污染指数

本网站采用的污染指数和颜色与EPA是完全相同的。 EPA的指数可以从 AirNow上查到

空气质量指数空气质量指数级别(状况)及表示颜色对健康影响情况建议采取的措施
0 - 50一级(优)空气质量令人满意,基本无空气污染各类人群可正常活动
51 -100二级(良)空气质量可接受,但某些污染物可能对极少数异常敏感人群健康有较弱影响极少数异常敏感人群应减少户外活动
101-150三级(轻度污染)易感人群症状有轻度加剧,健康人群出现刺激症状儿童、老年人及心脏病、呼吸系统疾病患者应减少长时间、高强度的户外锻炼
151-200四级(中度污染)进一步加剧易感人群症状,可能对健康人群心脏、呼吸系统有影响儿童、老年人及心脏病、呼吸系统疾病患者避免长时间、高强度的户外锻炼,一般人群适量减少户外运动
201-300五级(重度污染)心脏病和肺病患者症状显著加剧,运动耐受力降低,健康人群普遍出现症状儿童、老年人及心脏病、肺病患者应停留在室内,停止户外运动,一般人群减少户外运动
300+六级(严重污染)健康人群运动耐受力降低,有明显强烈症状,提前出现某些疾病儿童、老年人和病人应停留在室内,避免体力消耗,一般人群避免户外活动
(参考详见http://zh.wikipedia.org/wiki/空气质量指数)

如果你想了解更多有关空气质量与污染,详见维基百科或者 AirNow

有关健康建议详见北京的Richard Saint Cyr MD医生的博客:www.myhealthbeijing.com


注意事项: 所有空气质量数据在发布时均未经验证,并且为了保证数据质量,这些数据可能随时被修改,恕不另行通知。 世界空气质量指数项目在编制此信息的内容时已经运用了所有合理的技能和谨慎,在任何情况下世界空气质量指数项目团队或其代理人将不会为由于提供此数据而直接或间接引起的伤害、合同损失、侵权及其他任何损失负责。


设置


选择语言:


Temperature unit:
Celcius