Jingzhou AQI: Jingzhou Real-time Air Quality Index (AQI). |
- | Not Available - temperature: -°C |
| current | past 2 days | min | max | ||||||||||||||||||||||||||||||||||||||||||||||||||||||||||||||||||||||||||||||||||||
Weather Information | |||||||||||||||||||||||||||||||||||||||||||||||||||||||||||||||||||||||||||||||||||||||
Temp. | - | 2 | 11 | ||||||||||||||||||||||||||||||||||||||||||||||||||||||||||||||||||||||||||||||||||||
Pressure | - | 1027 | 1030 | ||||||||||||||||||||||||||||||||||||||||||||||||||||||||||||||||||||||||||||||||||||
Humidity | - | 56 | 99 | ||||||||||||||||||||||||||||||||||||||||||||||||||||||||||||||||||||||||||||||||||||
Wind | - | 1 | 3 | ||||||||||||||||||||||||||||||||||||||||||||||||||||||||||||||||||||||||||||||||||||
Rain | - | 0 | 1 | ||||||||||||||||||||||||||||||||||||||||||||||||||||||||||||||||||||||||||||||||||||
Air Quality Data provided by: the Hubei Environmental Protection Agency (湖北省环境保护厅) (hbepb.gov.cn)
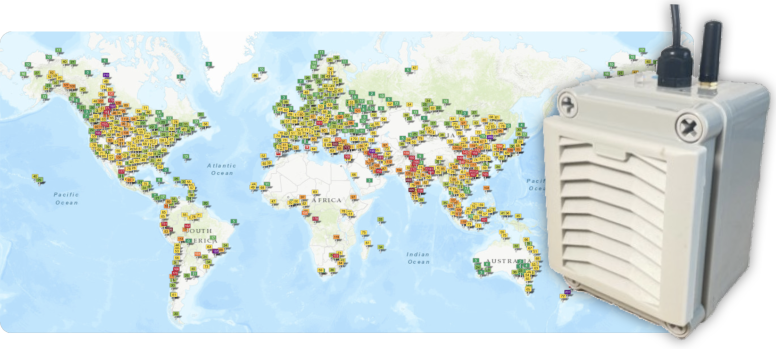
Do you know of any Air Quality stations in your area? why not participate to the map with your own air quality station?
> aqicn.org/gaia/ <
Share: “How polluted is the air today? Check out the real-time air pollution map, for more than 100 countries.”
Share: “Jingzhou Air Pollution: Real-time Air Quality Index (AQI)”
Cloud API
This air quality monitoring station real-time data can be programmatically accessed using this API url: (For more information, check the API page:aqicn.org/api/ or aqicn.org/data-platform/api/H3674)
