Geraldton Air Pollution: Real-time Air Quality Index (AQI)


Geraldton AQI: Geraldton Real-time Air Quality Index (AQI).
6
Good
Updated on Tuesday 23:00
Primary pollutant: pm10
currentpast 2 daysminmax
PM2.5 AQI
5Geraldton, Australia PM25 (fine particulate matter)  measured by  Western Australia Air Quality Management Branch.
Values are converted to the US EPA AQI standard.214
PM10 AQI
6Geraldton, Australia PM10 (respirable particulate matter)  measured by  Western Australia Air Quality Management Branch.
Values are converted to the US EPA AQI standard.115
Weather Information
Temp.
27Geraldton, Australia  t (temp.)  measured by Citizen Weather Observer Program (CWOP/APRS).1833
Pressure
1010Geraldton, Australia  p (pressure:)  measured by Citizen Weather Observer Program (CWOP/APRS).10071012
Humidity
47Geraldton, Australia  h (humidity)  measured by Citizen Weather Observer Program (CWOP/APRS).3093
Wind
7Geraldton, Australia  w (wind)  measured by Citizen Weather Observer Program (CWOP/APRS).111
MarkerMarkerMarkerMarkerMarkerMarkerMarkerMarker
map © OpenStreetMap contributors

Air Quality Forecast
WED 19
27°C
24°C
THU 20
25°C
23°C
FRI 21
23°C
23°C
SAT 22
23°C
19°C
PM2.5
O3
Wednesday 19Thursday 20Friday 21Saturday 22
hour
036912151821036912151821036912151821036912151821036
Wind Speed (m/s)
75448765555678998888911121313131210111314141077


Temp.
25°25°24°27°24°25°25°25°25°24°24°24°24°24°24°24°23°23°23°23°23°23°23°23°22°21°19°20°22°22°22°23°23°23°23°
relative humidity
6468686480838484828383848582818179757270696870706969706359636662453635
barometric pressure
10101010101110111009100910111012101110111012101410131013101410151014101410161016101610151016101710161016101810181015101410141014101410131014
UVI:
11+


6:07 ~ 19:06
UVI:
11+


6:08 ~ 19:05
UVI:
11+


6:09 ~ 19:04
UVI:
11+


6:09 ~ 19:03
Forecast plotted using timezone +08:00

Air Quality Data provided by: the Western Australia Air Quality Management Branch (der.wa.gov.au)

Do you know of any Air Quality stations in your area? why not participate to the map with your own air quality station?
Learn more at
> aqicn.org/gaia/ <
Share: “How polluted is the air today? Check out the real-time air pollution map, for more than 100 countries.
https://aqicn.org/here/
Share: “Geraldton, Australia Air Quality is Good - on Tuesday, Feb 18th 2025, 23:00 pm
https://aqicn.org/snapshot/australia/western/geraldton/20250218-23/?cs
Cloud API
This air quality monitoring station real-time data can be programmatically accessed using this API url: (For more information, check the API page:aqicn.org/api/ )

Looking for another city?


Do you know of any Air Quality stations in your area?
why not participate to the map with your own air quality station?

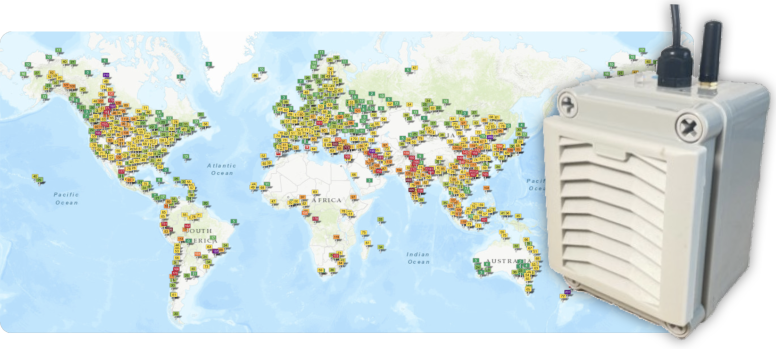
Our GAIA air quality monitors are very easy to set up: You only need a WIFI access point and a USB compatible power supply.

Once connected, your real time air pollution levels are instantaneously available on the maps and through the API.

The station comes with a 10-meter water-proof power cable, a USB power supply,mounting equipment and an optional solar panel.

Air quality historical data


Air Quality Rankings

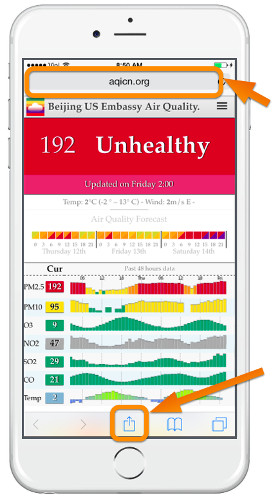
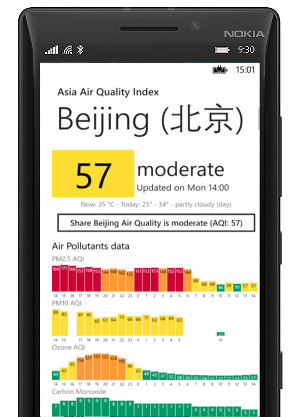
Download the real-time Air Quality Index Widget for:


iPhone & iPad
Android
Windows Phone
Windows PC
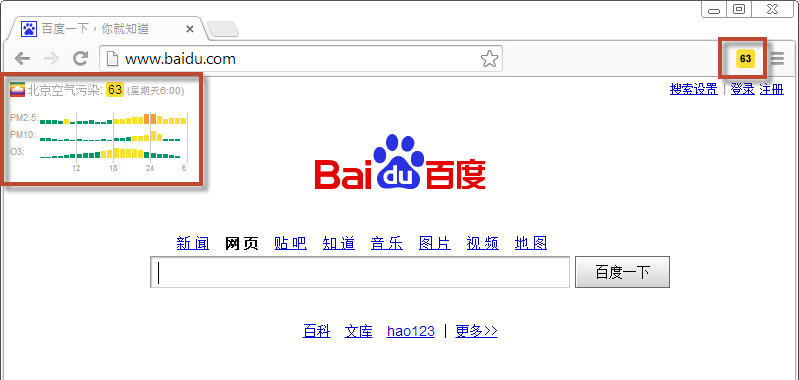
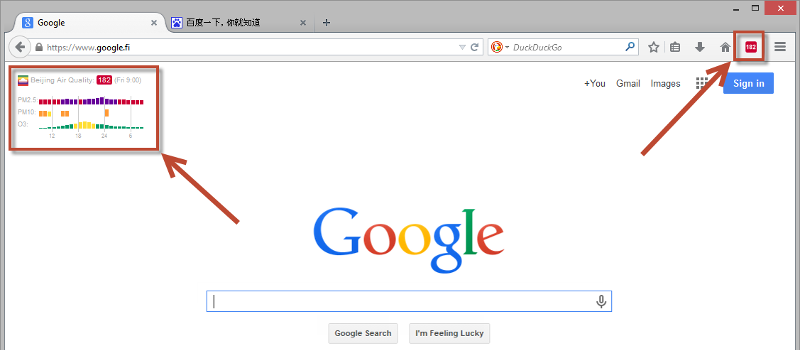
Google Chrome
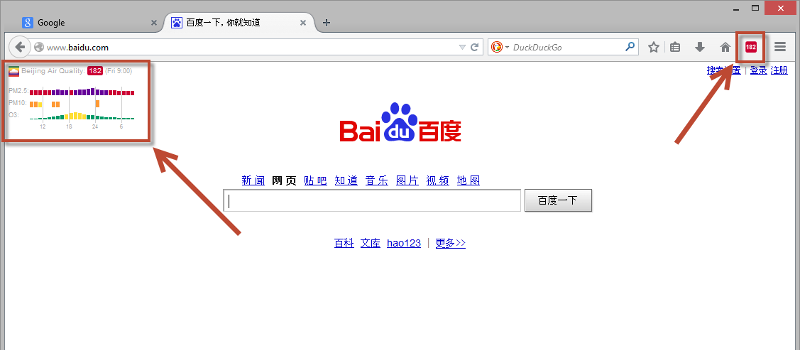
Firefox
Wordpress
Cloud API


Looking for more air quality related products?


About the Air Quality and Pollution Measurement:

About the Air Quality Levels

AQIAir Pollution LevelHealth ImplicationsCautionary Statement (for PM2.5)
0 - 50GoodAir quality is considered satisfactory, and air pollution poses little or no riskNone
51 -100ModerateAir quality is acceptable; however, for some pollutants there may be a moderate health concern for a very small number of people who are unusually sensitive to air pollution.Active children and adults, and people with respiratory disease, such as asthma, should limit prolonged outdoor exertion.
101-150Unhealthy for Sensitive GroupsMembers of sensitive groups may experience health effects. The general public is not likely to be affected.Active children and adults, and people with respiratory disease, such as asthma, should limit prolonged outdoor exertion.
151-200UnhealthyEveryone may begin to experience health effects; members of sensitive groups may experience more serious health effectsActive children and adults, and people with respiratory disease, such as asthma, should avoid prolonged outdoor exertion; everyone else, especially children, should limit prolonged outdoor exertion
201-300Very UnhealthyHealth warnings of emergency conditions. The entire population is more likely to be affected.Active children and adults, and people with respiratory disease, such as asthma, should avoid all outdoor exertion; everyone else, especially children, should limit outdoor exertion.
300+HazardousHealth alert: everyone may experience more serious health effectsEveryone should avoid all outdoor exertion

To know more about Air Quality and Pollution, check the wikipedia Air Quality topic or the airnow guide to Air Quality and Your Health.

For very useful health advices of Beijing Doctor Richard Saint Cyr MD, check www.myhealthbeijing.com blog.


Usage Notice: All the Air Quality data are unvalidated at the time of publication, and due to quality assurance these data may be amended, without notice, at any time. The World Air Quality Index project has exercised all reasonable skill and care in compiling the contents of this information and under no circumstances will the World Air Quality Index project team or its agents be liable in contract, tort or otherwise for any loss, injury or damage arising directly or indirectly from the supply of this data.


Settings


Language Settings:


Temperature unit:
Celcius