(credits)
Trở lại năm 2008, khi dự án Chất lượng Không khí Thế giới bắt đầu, tất cả các trạm quan trắc chất lượng không khí hiện có đều dựa trên công nghệ BAM và TOEM có tính chuyên nghiệp cao và đắt tiền. Loại trạm này luôn được bảo trì bởi những người vận hành chuyên nghiệp và có trình độ cao - và điều này đảm bảo rằng đầu ra của trạm này có thể được tin cậy.
12 năm sau, trạm BAM và TOEM vẫn tồn tại. Nhưng với sự phát triển của công nghệ tán xạ laser và cảm biến bụi chi phí thấp, các trạm BAM và TOEM giờ đây đã bị áp đảo bởi mạng lưới cảm biến chi phí thấp rộng lớn và dày đặc. Ngày nay, có rất nhiều mạng như vậy - có thể kể tên một số mạng: urad, luft-daten, airqo, airbg, opensense, yakaw, econet, airkaz, ccdc, ambente, green air, v.v..
Một trong những vấn đề cơ bản với mạng cảm biến chi phí thấp là độ tin cậy của chúng: Vì nhiều cảm biến trong số đó không được bảo trì đúng cách (hoặc hoàn toàn không được bảo trì), nên số lượng cảm biến tạo ra phép đo sai hoàn toàn là không đáng kể. Hơn nữa, hầu hết mạng không sử dụng các trạm có cảm biến sao chép (không giống như trạm Gaia của chúng tôi, sử dụng 3 cảm biến sao chép), khiến việc biết khi nào một cảm biến bị lỗi càng trở nên khó khăn hơn.
Trong bài viết này, chúng ta sẽ xem xét mạng cảm biến được triển khai tại thành phố Volos tuyệt vời ở Hy Lạp và nghiên cứu các phương tiện để xác định chất lượng và định lượng độ tin cậy của trạm trong thời gian thực.
--
Thành phố tuyệt vời Volos ở Hy Lạp
Volos (tiếng Hy Lạp: Βόλος) là một thành phố cảng ven biển. Với dân số 144.449 (2011), đây cũng là thành phố đông dân thứ sáu của Hy Lạp. Đây là một trung tâm công nghiệp quan trọng, đồng thời cảng của nó là cầu nối giữa châu Âu và châu Á. Hiện tại có 5 trạm ở Volos: Một trạm từ EPA của Hy Lạp , cung cấp dữ liệu hàng giờ từ trạm BAM chuyên nghiệp và 4 trạm thời gian thực chi phí thấp từ mạng lutf-daten :
Trạm Volos EPA được đặt tại tòa nhà của Cơ quan quản lý phi tập trung Thessaly và miền Trung Hy Lạp . Tất cả các ga khác cũng nằm trong khu dân cư, ngoại trừ Argonafton nằm cạnh cảng.
Giao thông tại cảng không đáng kể, trung bình có khoảng 8 tàu đến/đi mỗi ngày , với 80% tàu là hàng hóa - tại thời điểm viết bài.
Một trong những vấn đề được biết đến với hàng hóa có thể là ô nhiễm hạt từ ống xả do nhiên liệu chất lượng thấp . Nhưng nhìn vào bức tranh toàn cảnh từ nơi đặt trạm Argonafton, khoảng cách đến hàng hóa đủ xa để không chứng minh được nguồn ô nhiễm không khí liên tục. Người ta có thể mong đợi sẽ thấy một vài lần không khí ở Argonafton bị ô nhiễm hơn, đặc biệt là khi các tàu thuyền lớn đang điều động, nhưng không phải lúc nào cũng vậy. Rốt cuộc, đó chỉ là 8 chiếc tàu điều động một ngày.

--
Dữ liệu chuỗi thời gian trong 30 ngày qua
Dựa trên thông tin từ vị trí của các trạm, người ta có thể mong đợi rằng tất cả các trạm đều đồng ý về mức độ ô nhiễm không khí tương tự nhau, ngoại trừ các trường hợp ô nhiễm cao hơn lẻ tẻ ở Argonafton. Nhưng thật không may, điều này không thực sự đúng như vậy, như đã được xác nhận từ biểu đồ chuỗi thời gian bên dưới:
Biểu đồ chuỗi thời gian chỉ ra rõ ràng rằng dữ liệu của Argonafton dường như được ước tính quá cao so với các trạm khác. Tương tự, dữ liệu về Dimarxou dường như chưa được ước tính đầy đủ.
Cách tốt hơn để làm nổi bật vấn đề là trực quan hóa phần trăm AQI thứ 75 hàng ngày, được vẽ bằng dải màu AQI tương ứng. Sự khác biệt so với Argonafton là hiển nhiên. Hơn nữa, có thể phân biệt hai cụm tập trung xung quanh Riga-Feraiou+Kasthanaías và Volos EPA+Dimarxou.
--
Định lượng sự khác biệt về chuỗi thời gian
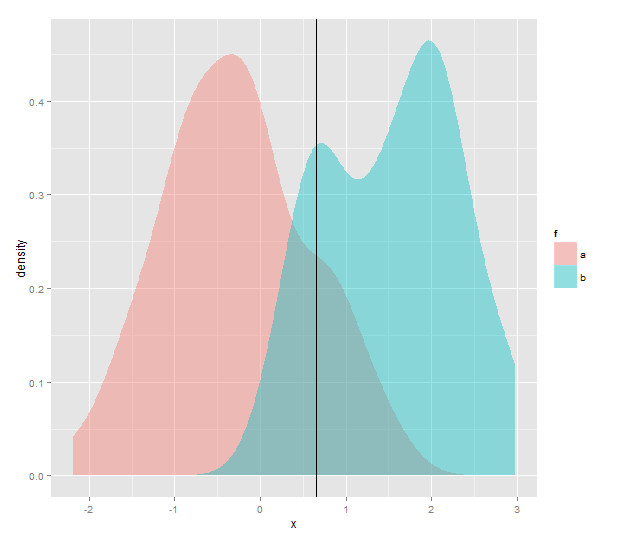
Khi so sánh các chuỗi thời gian tương quan, cách tốt nhất là so sánh phân bố xác suất của chúng. 3 biểu đồ bên dưới biểu thị phân bố mật độ, CDF (hàm phân phối tích lũy) và QQ (sử dụng Volos EPA làm CDF tham chiếu). Tất cả 3 biểu đồ đó đều dựa trên dữ liệu chuỗi thời gian trong 30 ngày qua, nhưng bạn cũng có thể chọn phạm vi thời gian cụ thể trong biểu đồ chuỗi thời gian đầu tiên và 3 biểu đồ đó sẽ được cập nhật bằng cách sử dụng các giá trị từ phạm vi thời gian nhất định.
Nhìn vào sự phân bổ xác suất bằng mắt thường, rõ ràng có sự khác biệt lớn giữa Argonafton, Dimarxou và trạm Volos EPA tham chiếu. Điều đáng chú ý là có một "vết sưng" xung quanh AQI 150: Lý do là sơ đồ phân phối dựa trên AQI chứ không phải nồng độ thô và phạm vi AQI [150.200] nhỏ gọn hơn (so với [100.150]) khiến AQI đậm đặc hơn ở mức >150 so với <150.
Khi định lượng sự khác biệt này, có thể sử dụng khái niệm khoảng cách thống kê để định lượng “mức độ phù hợp”. Khoảng cách nổi tiếng nhất là khoảng cách Kolmogorov-Smirnov, Wasserstein và Cramér-von Mises (để có phần giới thiệu hay về những khoảng cách đó, hãy tham khảo phần giải thích tuyệt vời này ). Bảng bên dưới hiển thị khoảng cách dựa trên dữ liệu 30 ngày (các giá trị sẽ được cập nhật nếu bạn chọn phạm vi thời gian từ biểu đồ chuỗi thời gian chính).
| Station | | | | |
|---|
Trong khi khoảng cách Kolmogorov-Smirnov không thể hiện chính xác khoảng cách tương đối (làm nổi bật Dimarxou đến tận Argonafton), cả khoảng cách Wasserstein và Cramér-von Mises đều nêu bật khoảng cách lớn hơn rõ ràng đối với Argonafton. Các giá trị trong bảng trên dựa trên dữ liệu 30 ngày. 3 biểu đồ bên dưới dựa trên đường trung bình động 7 ngày trong 30 ngày qua.
Những biểu đồ đó xác nhận rằng khi sử dụng khoảng cách Wasserstein hoặc Cramér-von, khoảng cách từ trạm Argonafton và Volos EPA liên tục cao hơn ít nhất hai lần khoảng cách so với các trạm khác.
Dữ liệu khí tượng tương quan
Để xác nhận giả thuyết rằng trạm Argonafton đang tạo ra các chỉ số nồng độ bất thường và được ước tính quá cao, chúng ta cần xem xét dữ liệu khí tượng: Điều kiện mà trạm Argonafton có thể thấy nồng độ cao hơn là khi gió thổi từ phía nam, tức là nơi gió sẽ mang khói từ ống xả hàng hóa về phía nhà ga.
Bước đầu tiên là kiểm tra hướng và tốc độ gió trung bình trong 30 ngày qua. Dữ liệu gió được lấy từ cả trạm METAR của Sân bay Volos cũng như trạm thời tiết Netatmo Tthiseos . Hai bông hồng gió tượng trưng cho số lần gió thổi theo mỗi hướng.
Cả hai ô hoa hồng gió đều cho thấy gió chủ yếu thổi từ hướng Tây hoặc hướng Đông và ít hơn nhiều từ hướng Nam. Vì có những ngọn núi ở phía bắc của Volos nên về cơ bản không có gió phía dưới từ phía bắc.
Dựa trên xác nhận thực nghiệm này rằng gió thổi từ phía Nam ít hơn so với các hướng khác, không thể suy luận rằng ống xả hàng hóa là nguyên nhân khiến nồng độ PM 2.5 cao hơn ở trạm Argonafton. Giả thuyết này cũng bị vô hiệu bởi biểu đồ tương quan giữa 3 trạm và hướng gió của Sân bay, cho thấy không có bằng chứng rõ ràng (đối với bất kỳ trạm nào) rằng gió phía nam hàm ý nồng độ cao.
Cuối cùng, chúng tôi cũng cần kiểm tra xem sự cố với Argonafton có liên quan đến độ ẩm tương đối hay không. Ví dụ, vấn đề có thể là do độ ẩm cao hơn làm cho kích thước hạt lớn hơn và do đó hàm ý nồng độ cao hơn. Biểu đồ tương quan bên dưới xác nhận rằng điều này không đúng vì không có bằng chứng rõ ràng nào cho thấy nồng độ tỷ lệ thuận với độ ẩm.
Phần kết luận
Trong bài viết này, chúng tôi đã xem xét các phương tiện định lượng và đánh giá chất lượng dữ liệu cho các trạm thời gian thực. Giả sử rằng có một trạm tham chiếu đáng tin cậy, chúng tôi đã chỉ ra rằng việc định lượng bằng khoảng cách Cramér-von Mises hoặc Wasserstein có thể chỉ ra các vấn đề với bất kỳ dữ liệu trạm nào.
Chúng tôi cũng đã chỉ ra rằng bản thân khoảng cách là chưa đủ, và nói chính xác hơn, cần phải hiểu bối cảnh của nhà ga. chẳng hạn như vị trí và điều kiện khí tượng của nó. Tuy nhiên, do bối cảnh không phải là thứ có thể tự động hóa nên giải pháp cuối cùng được sử dụng cho dự án WAQI bao gồm trạm đủ điều kiện có khoảng cách thống kê đến trạm tham chiếu nhỏ hơn 1/4. Điều này sẽ có hiệu lực trong những tuần tới (xem aqicn.org/station/ để biết bản đồ các trạm theo thời gian thực.
Bài viết này là một phần của loạt bài này và trong bài viết tiếp theo, chúng ta sẽ xem xét các phương tiện của trạm đủ điều kiện mà không có sẵn trạm tham chiếu.
--

