(credits)
早在2008年,當世界空氣品質計畫啟動時,所有現有的空氣品質監測站都基於高度專業且昂貴的BAM和TOEM技術。此類工作站始終由專業且高素質的操作員維護 - 這確保了該工作站的輸出值得信賴。
12 年後,BAM 和 TOEM 站仍然存在。但隨著雷射散射技術和低成本灰塵感測器的發展,BAM 和 TOEM 站的數量現在已經被巨大而密集的低成本感測器網路所取代。如今,這類網路非常多,僅舉幾例:urad、luft-daten、airqo、airbg、opensense、yakkaw、econet、airkaz、ccdc、ambente、green air 等。
低成本感測器網路的基本問題之一是其可靠性:由於許多感測器沒有得到適當維護(或根本沒有維護),因此產生完全錯誤測量的感測器數量不容忽視。此外,大多數網路不使用具有複製感測器的站(與我們的Gaia站不同,它使用 3 個複製感測器),這使得了解單一感測器何時發生故障變得更加困難。
在本文中,我們將研究部署在希臘美麗城市沃洛斯的感測器網絡,並研究即時鑑定和量化站點可靠性的方法。
--
希臘美麗的沃洛斯市
沃洛斯(希臘文:Βόλος)是沿海港口城市。它的人口為 144,449 人(2011 年),也是希臘人口第六大城市。它是重要的工業中心,其港口是歐洲和亞洲之間的橋樑。沃洛斯目前有 5 個監測站:1 個來自希臘 EPA ,由專業的 BAM 監測站提供每小時數據,以及 4 個來自lutf-daten網路的低成本即時監測站:
沃洛斯 EPA 站位於色薩利和希臘中部權力下放管理局大樓內。除靠近港口的 Argonafton 站外,所有其他站也都位於住宅區。
港口的交通量不容忽視,截至撰寫本文時,平均每天約有 8 艘船舶抵達/出發,其中 80% 的船舶是貨物。
貨物的已知問題之一可能是由於劣質燃料造成的排氣管顆粒污染。但從阿戈納夫頓站所在地的全景來看,距離貨物的距離足夠遠,不足以證明持續的空氣污染源是合理的。人們可能會在阿爾戈納夫頓的空氣污染較嚴重時看到幾次,特別是在大型船隻航行時,但並非總是如此。畢竟,每天只有 8 艘船在航行。

--
過去30天的時間序列數據
根據監測站位置訊息,可以預期所有監測站的空氣污染水平都相似,但阿戈納夫頓 (Argonafton) 偶發的污染較高的事件除外。但不幸的是,事實並非如此,正如下面的時間序列圖所證實的:
時間序列圖清楚地表明,與其他站相比, Argonafton的數據似乎被高估了。同樣, Dimarxou的數據似乎也被低估了。
更好地強調這個問題的方法是可視化每日第 75 個 AQI 百分位,使用相應的 AQI 顏色範圍繪製。與 Argonafton 的偏差是顯而易見的。此外,可以區分以 Riga-Feraiou+Kasthanaías 和 Volos EPA+Dimarxou 為中心的兩個群集。
--
量化時間序列差異
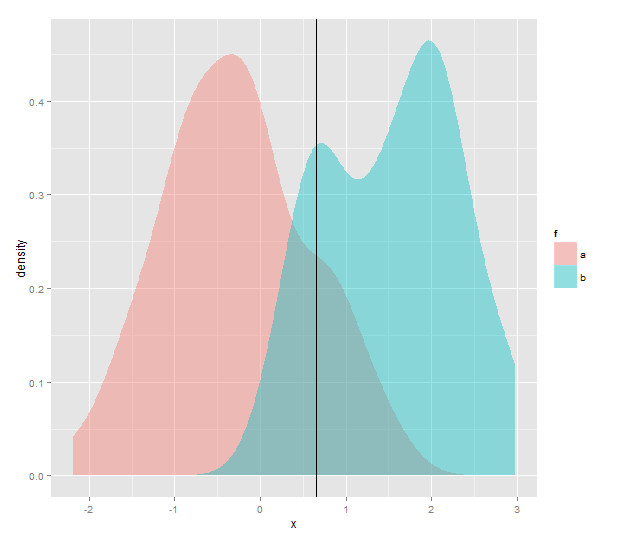
在比較相關時間序列時,最好是比較它們的機率分佈。下面的 3 張圖分別代表密度分佈、CDF(累積分佈函數)和 QQ(使用 Volos EPA 作為參考 CDF)。所有 3 個圖表均基於過去 30 天的時間序列數據,但您也可以在第一個時間序列圖表中選擇特定時間範圍,這 3 個圖表將使用給定時間範圍內的值進行更新。
Looking at the probabilistic distribution with a naked eye, it is obvious that there is a big difference between Argonafton, Dimarxou and the reference Volos EPA station. It is worth noticing that there is a "bump" around AQI 150: The reason is that the distribution plot is based on the AQI rather than the raw concentration, and the more compact [150,200] AQI range (compared to [100,150]) make the AQI denser for >150 compared to <150.
在量化這種差異時,可以使用統計距離的概念來量化「擬合優度」。最著名的距離是 Kolmogorov-Smirnov、Wasserstein 和 Cramér-von Mises 距離(這些距離的詳細介紹,請參閱這篇精彩的解釋)。下表顯示了基於 30 天資料的距離(如果您從主時間序列圖中選擇時間範圍,則值將更新)。
| Station | | | | |
|---|
雖然 Kolmogorov-Smirnov 距離無法正確捕捉相對距離(突出顯示 Dimarxou 遠至 Argonafton),但 Wasserstein 和 Cramér-von Mises 距離都突出顯示 Argonafton 的距離明顯更大。上表中的數值是基於 30 天的數據。下面的 3 個圖表是根據過去 30 天的 7 天移動平均線。
這些圖表確實證實,無論使用 Wasserstein 距離還是 Cramér-von 距離,Argonafton 站和沃洛斯 EPA 之間的距離始終至少是其他站距離的兩倍。
關聯氣象數據
為了證實Argonafton站產生異常且高估的濃度讀數的假設,我們需要查看氣象數據:Argonafton站出現較高濃度的條件是當風從南邊吹來時,即風將貨物排氣管的煙霧吹向車站的地方。
第一步是檢查過去 30 天內的平均風向和風速。風數據來自沃洛斯機場 METAR站和Netatmo Tthiseos氣象站。兩個風玫瑰圖代表風向每個方向吹的次數。
兩張風玫瑰圖均顯示風主要從西風或東風吹來,南風則較少。由於沃洛斯北部有山脈,因此下面基本上沒有北風。
根據這項經驗證實,從南面吹來的風比從其他方向吹來的風要少,不可能推斷出貨物排氣管是造成 Argonafton 站 PM 2.5濃度較高的原因。 3 個站點與機場風向之間的相關圖也證明了這一假設無效,該圖表明沒有明確的證據(對於任何站點)表明南風意味著高濃度。
最後,我們還需要檢查 Argonafton 的問題是否與相對濕度有關。例如,問題可能是由於較高的濕度導致顆粒尺寸較大,這意味著較高的濃度。以下的相關圖證實這是不正確的,因為沒有明確的證據顯示濃度與濕度成正比。
結論
在本文中,我們一直在研究量化和限定即時站資料品質的方法。假設有一個參考可信站,我們已經證明,使用 Cramér-von Mises 或 Wasserstein 距離進行量化可以表明任何站數據存在問題。
我們也表明,距離本身是不夠的,更準確地說,應該理解車站的上下文。例如它的位置和氣象條件。然而,由於上下文無法自動化,因此 WAQI 專案使用的最終解決方案包括與參考站的統計距離小於 1/4 的合格站。這將在未來幾週內生效(有關即時網站地圖,請參閱aqicn.org/station/ 。
本文是該系列的一部分,在下一篇文章中,我們將研究沒有參考站的情況下的資格站方法。
--

