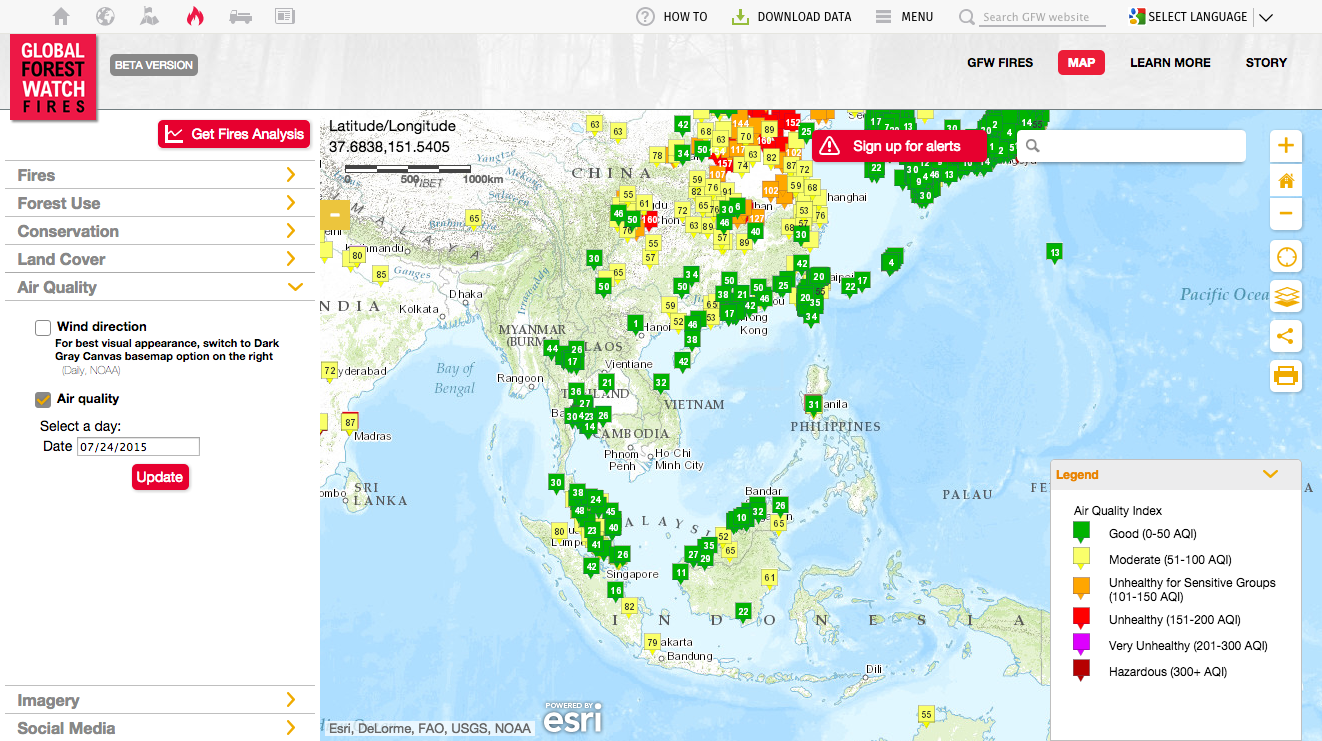
우리는 최근 전 세계적으로 더 많은 EPA(환경 보호 기관)와 협력하고 있습니다. 우리가 요청한 모든 것 중 실제로는 EPA가 웹사이트에서 실시간 대기 질 데이터를 지도에 포함할 수 있도록 웹 지도 서비스를 제공하는 것이었습니다.
우리가 제공하는 지도 웹 서비스를 사용하는 분명한 이점 중 하나는 우리가 관리하는 국경 간 데이터의 혜택을 누릴 수 있다는 것입니다. 즉, 전 세계 대기 질 정보가 국가 경계 없이 제공됩니다.
두 번째 장점은 이 서비스가 무료일 뿐만 아니라 google, bing 또는 leaflet의 표준 지도 기술과 완벽하게 호환되므로 기존 웹사이트와 빠르고 쉽게 통합할 수 있다는 것입니다.
--
타일 맵 서비스 엔드포인트
타일 맵 서버는 URL `https://tiles.aqicn.org/tiles/{aqi}/{z}/{x}/{y}.png`에서 사용할 수 있습니다. 여기서 aqi 마커 유형을 나타냅니다. 다음과 같이 플롯할 수 있습니다.
usepa-aqi: Plots markers based on the composite AQI calculated with the US EPA standard.usepa-pm25: PM2.5 based AQI - if a station does not have PM2.5 reading, then it is not plotted.usepa-10: Same as above, but for PM10.usepa-o3: Same as above, but for Ozone (based on the 1 hour breakpoints).usepa-no2: Same as above, but for Nitrogen Dioxide.usepa-so2: Same as above, but for Sulfur Dioxide.usepa-co: Same as above, but for Carbon Monoxide.asean-pm10: Asean PM10 raw PM10 concentration (explanations).
아래는 중국 남부의 6개 개별 오염물질에 대한 예입니다.
웹서비스 이용조건
지도 웹 서비스는 합리적인 사용 제한 및 허용 가능한 사용 정책에 따라 무료로 제공됩니다. 타일은 현재 15분마다(트래픽이 많은 경우 최대 1시간) 새로 고쳐집니다.
당사의 서버 용량은 제한되어 있으므로 당사는 성능 서버 유지 관리 등을 위해 언제든지 서비스를 일시 중지할 권리를 보유합니다. 보다 안정적인 통합이 필요한 경우 전용 서버 설정 등 적절한 솔루션을 찾으려면 당사에 문의하십시오.
마지막으로 다음 URL의 `token=_TOKEN_ID_`와 같이 타일 서비스 엔드포인트에 대한 추가 인수로 자체 토큰 ID를 지정해야 합니다: `https://tiles.aqicn.org/tiles/{aqi}/{z }/{x}/{y}.png? 토큰=_TOKEN_ID_ `.
이 페이지 에서 자신의 토큰 ID를 요청할 수 있습니다. 유효한 이메일을 제공하기만 하면 1분 안에 자신만의 토큰을 얻을 수 있습니다.
웹 서비스 이용 제한

서비스를 사용할 때 세계 대기 질 지수 프로젝트 와 데이터를 제공하는 EPA에 대한 속성을 제공하는 것을 잊지 마십시오(특정 위치 또는 소스의 데이터를 표시하기 위해 지도 서비스를 사용하는 경우). 이 링크 에서 모든 EPA의 전체 목록을 얻을 수 있습니다.
사실, 세계 자원 연구소 (WRI)처럼 행동하지 마십시오. 그들은 우리의 전체 데이터 피드를 폐기하고 우리 작업에 대한 단일 속성을 제공하지 않고 자체 프로젝트 웹 사이트에 데이터를 다시 게시하고 있었습니다... 그건 별로 좋지 않습니다. 매년 최대 8천만 달러의 자금을 지원받는다는 사실을 알게 되면 말이죠. 우리를 믿지 못하시나요? 이 스냅샷을 확인하세요.
향후 확장
우리는 이미 이 웹 서비스를 확장하여 더 많은 구성을 제공하기 위해 노력하고 있습니다. 예를 들어:
- To support for more standards other than the US EPA, such as `eucaqi-xxx` for the European Common Air Quality Index, `innaqi-xxx` for the Indian National Air Quality Index , `raw-xxx` for the unconverted raw data, etc.
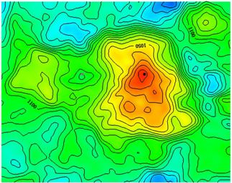
wind(현재 풍속 및 풍향 모두에 대한) 및 예측에 매우 유용할 수 있는 예상ventilation지수 [1] 와 같은 더 많은 지표.kriging통계적 표면 추정 크리깅 지원 - 즉, 저밀도 모니터링 네트워크에 유용할 수 있는 보간(오른쪽 그림)과 같은 히트맵입니다.24 hours및8 hours데이터 평균화를 지원합니다. 우리의 지도는 현재 1시간 평균을 기준으로 하고 있지만 역학 연구에는 평균 기간이 길수록 유용합니다.GeoJSON기반 타일 렌더링을 지원하여 마커 및 색상 스케일을 사용자 정의할 수 있을 뿐만 아니라 tuftjs.org 와 같은 도구와 더 효과적으로 통합할 수 있습니다.
더 많은 AQI 표준과 타일 구성을 지원하려면 서버 용량(처리 성능과 스토리지 모두)을 늘려야 하며 이를 위해서는 후원이 필요합니다. 대규모 클라우드 회사(예: Google 또는 Microsoft) 중 한 곳에서 일하고 이 메시지를 읽고 있다면 회사를 환경 친화적으로 만들고( 시민 인식 제고를 통해 대기 오염 방지 ) 필요한 서버의 일부를 후원하는 것을 고려해보세요. 추가 용량? 이는 우리에게 도움이 될 뿐만 아니라 환경 데이터 및 과학을 다루는 연구자, 과학자, 통계학자 및 전염병학자로 구성된 전체 커뮤니티에도 도움이 될 것입니다.
--

샘플 코드: Leaflet과 통합
Leaflet은 MapBox의 Vladimir Agafonkin이 만든 모바일 친화적인 대화형 지도를 위한 매우 멋지고 가벼운 오픈 소스 JavaScript 라이브러리입니다.
<div id='map' style='height:380px;' />
<link rel="stylesheet" href="http://cdn.leafletjs.com/leaflet-0.7.5/leaflet.css" />
<script src="http://cdn.leafletjs.com/leaflet-0.7.5/leaflet.js"></script>
<script>
var OSM_URL = 'http://{s}.tile.openstreetmap.org/{z}/{x}/{y}.png';
var OSM_ATTRIB = '© <a href="http://openstreetmap.org/copyright">OpenStreetMap</a> contributors';
var osmLayer = L.tileLayer(OSM_URL, { attribution: OSM_ATTRIB });
var WAQI_URL = "https://tiles.waqi.info/tiles/usepa-aqi/{z}/{x}/{y}.png?token=_TOKEN_ID_";
var WAQI_ATTR = 'Air Quality Tiles © <a href="http://waqi.info">waqi.info</a>';
var waqiLayer = L.tileLayer(WAQI_URL, { attribution: WAQI_ATTR });
var map = L.map('map').setView([51.505, -0.09], 11);
map.addLayer(osmLayer).addLayer(waqiLayer);
</script>
샘플 코드: Google과 통합
Google 지도는 매우 편리하며 하루 최대 25,000개의 API 호출을 무료로 제공합니다. Google 지도는 중국에서 사용할 수 있지만 지도 API 스크립트는 일반 https://maps 대신 google.cn(`http://maps.google.cn/maps/api/js`)에서 로드해야 합니다. .googleapis.com/maps/api/js URL.
<div  id='map'  style='height:380px;'  />
<script  src="https://maps.googleapis.com/maps/api/js"></script>

<script>
      var  map  =  new  google.maps.Map(document.getElementById('map'),  {
            center:  new  google.maps.LatLng(51.505,  -0.09),
            mapTypeId:  google.maps.MapTypeId.ROADMAP,
            zoom:  11
      });

      var  t  =  new  Date().getTime();
      var  waqiMapOverlay  =  new  google.maps.ImageMapType({
            getTileUrl:  function  (coord,  zoom)  {
                  return  'https://tiles.aqicn.org/tiles/usepa-aqi/'  +  zoom  +  "/"  +  coord.x  +  "/"  +  coord.y  +  ".png?token=_TOKEN_ID_";
            },
            name:  "Air  Quality",
      });

      map.overlayMapTypes.insertAt(0,  waqiMapOverlay);
</script>
샘플 코드: Microsoft Bing Maps와의 통합
Bing 지도는 실제로 매우 훌륭하며 일부 국가에서는 Here 기본 지도를 사용합니다. Microsoft Maps(특히 대기 질 및 날씨 분야)를 기반으로 하는 웹 사이트가 여전히 많이 있습니다.
<div  id='map'  style='height:380px;'    style='position:relative;'/>
<script  type='text/javascript'  src='https://www.bing.com/api/maps/mapcontrol?callback=initBingMap'  async  defer></script>

<script>
      function  initBingMap()  {

            var  map  =  new  Microsoft.Maps.Map(document.getElementById('map'),  {
                  center:  new  Microsoft.Maps.Location(51.505,  -0.09),
                  zoom:  11,
            });

            var  options  =  {
                  uriConstructor:  "https://tiles.aqicn.org/tiles/usepa-aqi//{zoom}/{x}/{y}.png?token=_TOKEN_ID_",
                  minZoom:  1,
                  maxZoom:  15
            };
            var  waqiTileSource  =  new  Microsoft.Maps.TileSource(options);
            var  waqiTilelayer  =  new  Microsoft.Maps.TileLayer({  mercator:  waqiTileSource  });
            map.layers.insert(waqiTilelayer);
      }
</script>