Od samego początku zespołowi projektowemu Światowego Indeksu Jakości Powietrza (WAQI) zawsze zależało na dostarczaniu obywatelom świata przejrzystych informacji o jakości powietrza.
Zjednoczony wysiłek
Projekt WAQI zawsze chciał także dostarczać historyczne dane o jakości powietrza odpowiednim instytucjom i organizacjom działającym w obszarze świadomości ekologicznej, monitorowania jakości powietrza, a także badań zdrowotnych i epidemiologicznych. Oto kilku naszych partnerów i współpracowników, którym dostarczamy historyczne dane dotyczące jakości powietrza:
Zjednoczone Ramy

Aby jeszcze bardziej zwiększyć przydatność rozpowszechniania historycznych danych o jakości powietrza, zespół Światowego Indeksu Jakości Powietrza wraz z najważniejszymi instytucjami międzynarodowymi badał możliwość stworzenia ram otwartych danych. Oto kilka instytucji, z którymi współpracujemy:
- WHO - WHO: Światowa Organizacja Zdrowia
- UNEP - UNEP: Program Narodów Zjednoczonych ds. Ochrony Środowiska
- UNIDO - UNIDO: Organizacja Narodów Zjednoczonych ds. Rozwoju Przemysłu
- WMO - WMO: Światowa Organizacja Meteorologiczna
- GEO - GEO: Grupa ds. Obserwacji Ziemi
- WRI - WRI: Światowy Instytut Zasobów
- CCAC - CCAC: Koalicja na rzecz Klimatu i Czystego Powietrza
- UNFCCC - UNFCCC: Ramowa konwencja Narodów Zjednoczonych w sprawie zmian klimatycznych
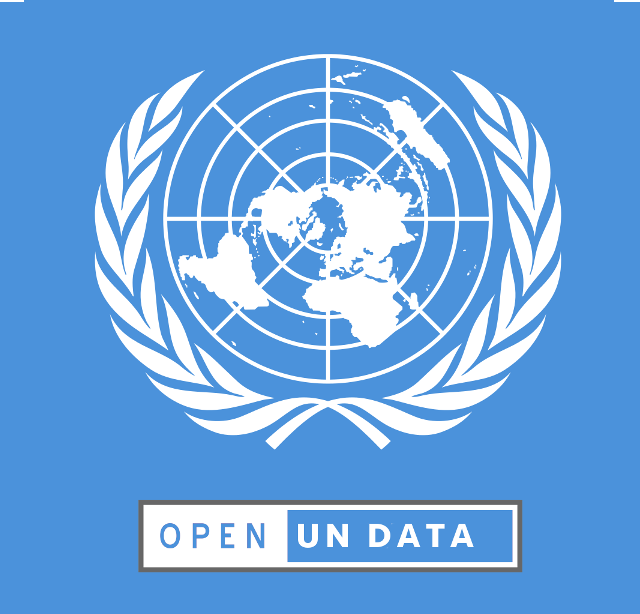
Zjednoczone Dane
Celem „Open Data Framework” jest zapewnienie nieograniczonego i bezpłatnego dostępu do światowych danych historycznych i danych dotyczących jakości powietrza w czasie rzeczywistym z ponad 100 krajów dostępnych na aqicn.org i waqi.info
Wszyscy – zarówno instytucje, jak i obywatele – są zgodni, że to nie tylko dobry pomysł, ale że po prostu powinno to nastąpić.

